Dallas doesn’t just run hot – it leads. When it comes to swimming pool construction, ownership trends, and aquatic infrastructure, the city consistently outpaces every other major metro in Texas. But behind the backyard oases and rooftop watering holes lies a fascinating story told through data: a market that’s remarkably resilient, a city grappling with aging public infrastructure, and a homeowner base that’s investing heavily in outdoor living.
Whether you’re a homeowner weighing the cost of a new pool, a contractor tracking permit activity, or a researcher studying urban aquatics, this data-driven guide compiles the most current and authoritative Dallas pool statistics available – all in one place.
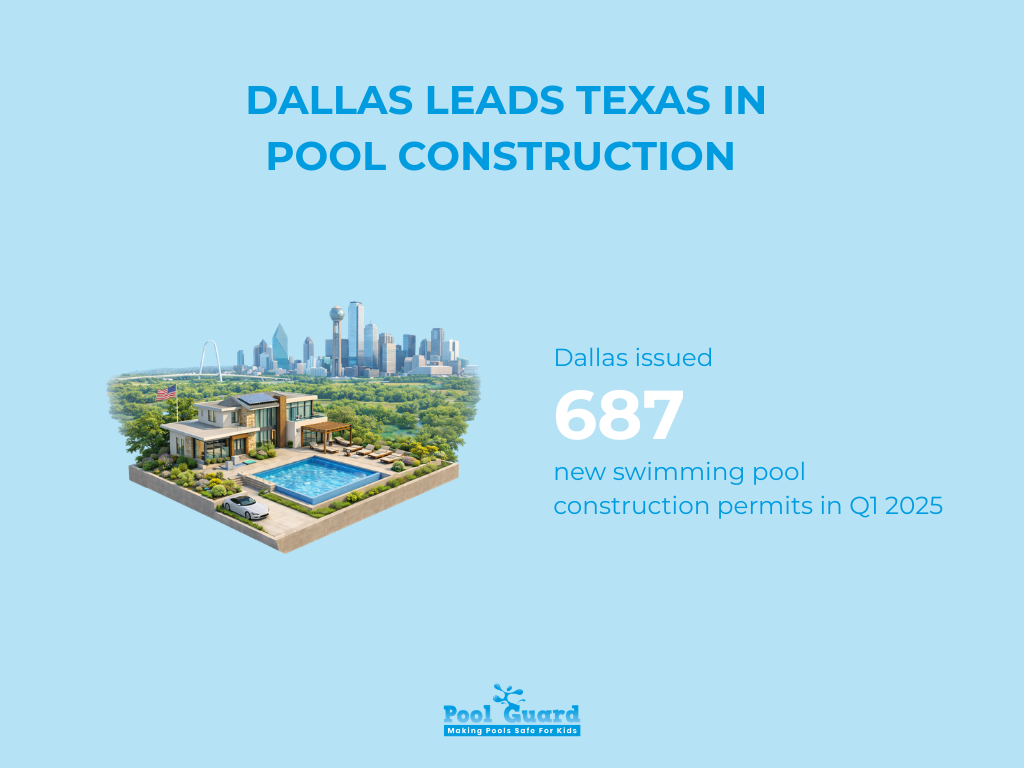
According to building permit data compiled from the HBW database, Dallas issued 687 new swimming pool construction permits in Q1 2025 – making it the single largest pool construction market in the entire state of Texas.
To put that in perspective:
| Metro Area | Q1 2025 Permits | YOY Change |
|---|---|---|
| Dallas | 687 | -4% |
| Houston | 429 | -13% |
| Austin | 188 | -41% |
| San Antonio | 154 | -13% |
Dallas didn’t just lead – it issued more permits than Houston, Austin, and San Antonio combined. Even as the broader Texas market declined 15% year-over-year statewide (from Q1 2024 to Q1 2025), Dallas held its ground with only a modest 4% dip. That’s a testament to the area’s robust housing demand and its deeply ingrained outdoor living culture.
“Dallas remains the most stable market, providing the best prospects for contractors seeking steady leads in 2025.” – HBW Weekly, Texas Swimming Pool Construction Report, Q1 2025
Dallas’s dominance isn’t confined to one ZIP code. When you drill down to the county level, three Dallas-area counties collectively account for a commanding share of statewide pool construction activity.
| County | Q1 2025 Permits | YOY Change |
|---|---|---|
| Dallas County | 206 | -15% |
| Collin County | 152 | -4% |
| Denton County | 151 | +28% |
Together, these three counties produced 509 permits – representing roughly 74% of the entire Dallas metro’s permit output.
The standout story here is Denton County, which bucked the statewide slowdown entirely, posting a remarkable 28% year-over-year increase. Industry analysts at HBW suggest Denton may be emerging as a new hotspot for residential pool construction – worth watching closely through the remainder of 2025.
Meanwhile, Dallas County’s 15% decline warrants attention, particularly for contractors who may want to pivot toward the northern suburban corridors where growth is accelerating.
To understand what Dallas’s resilience actually means, you need to see it against the broader Texas backdrop.
The Texas pool construction market has been in a multi-year deceleration:
Against this backdrop, Dallas’s -4% performance looks less like a slowdown and more like stability. The city’s consistently high housing turnover, suburban expansion, and strong demand for outdoor amenities continue to insulate it from the volatility hitting other Texas metros.
For pool contractors and suppliers, the actionable takeaway is clear: if you’re allocating marketing resources in Texas, Dallas – and specifically Denton and Collin counties – should be your primary focus in 2025.
A 2024 analysis by Plano Custom Pools examined nearly 27,709 home sales across 29 North Texas cities over a 12-month period ending June 2024. The result: 20.7% of homes sold in North Texas came with a pool.
Here’s the critical asterisk: that dataset explicitly excluded the city of Dallas itself, along with smaller rural towns. The researchers noted that including a high-density urban center like Dallas would pull the percentage down – meaning the true pool ownership rate when Dallas proper is factored in is likely somewhat below 20.7%.
This creates an important distinction for homeowners and real estate professionals:
For homeowners wondering whether to join the pool-owning majority, cost is the deciding factor. Here’s what the current Dallas market looks like:
| Expense | Frequency | Estimated Cost |
|---|---|---|
| Cleaning & chemical balancing | Weekly | $80–$150/month |
| Drain & filter cleaning | Every 3–6 months | $60–$125/session |
| Opening/closing | Twice yearly | $150–$300/event |
| Homeowner’s insurance bump | Annual | ~$50/year |
Yes, installing an inground pool can boost a home’s resale value by an estimated 5–7%. However, homeowners should note that a pool may also increase property tax assessments. The exact impact varies by Dallas County location and the assessed improvement value.
Dallas presents unique terrain considerations that affect pool costs:
Working with a contractor who knows Dallas’s specific geology is essential – not just for cost accuracy, but for long-term pool integrity.
Not every Dallas resident has a private backyard pool – and the city’s public aquatics infrastructure plays a vital role for thousands of families, particularly in southern Dallas neighborhoods.
The City of Dallas operates 9 community pools, 9 aquatic centers, and Bahama Beach Waterpark – a total of 20 water facilities citywide.
But the system is under strain. Here’s what the attendance and budget data reveals:
That’s a dramatic decline – community pool attendance in 2025 is running at less than half of 2023 levels, just seven weeks into the season.
The drop isn’t a mystery. A combination of factors has driven it:
The geographic dimension matters here: the majority of Dallas’s community pools sit south of I-30, serving neighborhoods where private pool access is far less common. Park board members specifically cited potential harm to these communities when opposing the 2024 closure proposals.
Pool statistics aren’t just about permits and prices. Drowning remains the leading cause of accidental death in children ages 1–4, and the CDC estimates that for every child who drowns, five more receive emergency care for non-fatal submersion injuries.
In a city where pool construction is booming and community pools serve thousands of families – many with young children – pool safety equipment isn’t optional. A pool alarm, compliant fencing, and a self-closing gate are the difference between a backyard oasis and a preventable tragedy.
At Poolguard USA, we specialize in ASTM-compliant pool alarms designed for exactly this environment – built for Texas summers, tested for real-world conditions.
Share this guide with a Dallas homeowner, contractor, or pool professional who needs the data. And if you’re building or upgrading a pool in the Dallas area, explore our full range of pool safety solutions at poolguardusa.com.
This city is Texas’s undisputed pool capital — and it isn’t close. Dallas leads the state in new pool construction, dominates county-level permit activity, and maintains the most stable market even as competing metros pull back sharply.
But these Dallas pool statistics also reveals real tension beneath the surface. While private pool investment remains strong, the public aquatics system that serves tens of thousands of Dallas families — particularly in southern neighborhoods — is operating at reduced capacity, with attendance at less than half of 2023 levels and infrastructure that dates back half a century.
For homeowners, contractors, and city planners alike, these Dallas pool statistics aren’t just numbers — they’re a roadmap. They show where growth is happening (Denton County), what it costs to participate ($50,000–$120,000+), and where the gaps in public access are widening.
One constant cuts across all of it: wherever pools exist, safety must follow. At Poolguard USA, we help Dallas families protect what matters most — because every pool, public or private, deserves a reliable first line of defense.
Please fill out the form below with your information. Your local dealer will be notified about your inquiry.
Please fill out the form below with your information. Your local dealer will be notified about your inquiry.