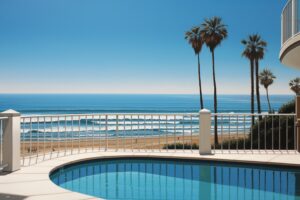
From the sky, Los Angeles looks like a mosaic of blue. But how many pools are really in L.A. – and what do they reveal about wealth, housing trends, and home value?
This definitive guide to Los Angeles pool statistics combines permit data, GIS research, property value studies, construction costs, and market trends to give you a complete, data-backed picture of pools in Los Angeles. Whether you’re a homeowner, investor, builder, or safety advocate, this is the data you need.
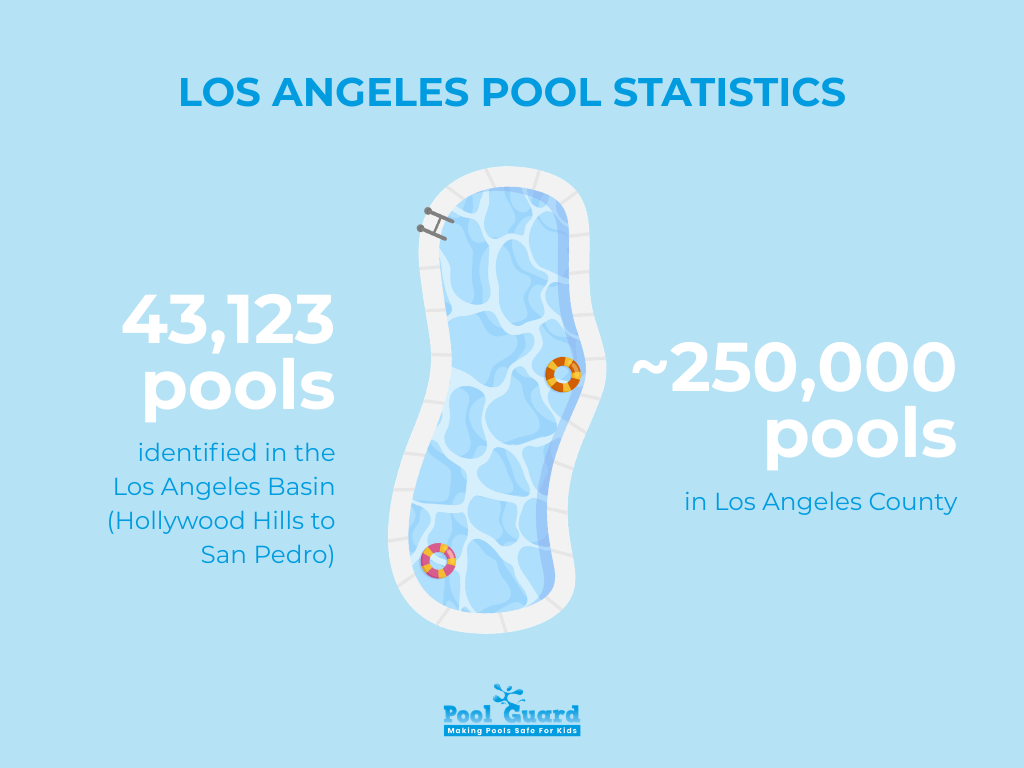
A comprehensive GIS analysis known as The Big Atlas of L.A. Pools identified 43,123 swimming pools between the Hollywood Hills and San Pedro. The study relied on aerial imagery from the National Agriculture Imagery Program (NAIP), parcel data, crime databases, and crowdsourced verification to map every visible pool within the Los Angeles Basin.
The geographic scope of the project stretched from the Hollywood Hills to San Pedro, though it excluded the San Fernando Valley and the San Gabriel Valley. The final atlas filled 6,000 pages across 74 volumes, and the physical production cost totaled $3,700.
The typical Los Angeles pool measures approximately 16 feet by 33 feet – more precisely, 16 feet 4 inches by 33 feet 6 inches – and is most commonly oval-shaped.
As the project described it, Los Angeles is home to “43,123 oases stitched together in a desert of hyper-urban reality.”
At the county level, estimates show there are approximately 250,000 swimming pools in Los Angeles County. Countywide, 18% of homes have a pool, and an overwhelming 96% of those pools are attached to single-family homes.
Pool ownership becomes even more concentrated in affluent communities. In Beverly Hills, 60% of homes have a pool, while in Hidden Hills, 87% of homes include one—making it one of the most pool-dense communities in the region.
The contrast is stark in lower-income neighborhoods. In Watts, only five pools were installed over a 20-year period, with the most recent installation occurring in 2012. In fact, the Basin-wide pool mapping study identified no backyard pools at all in Watts and Florence.
The distribution of pools closely mirrors wealth distribution across the metro area. In the Los Angeles metropolitan region, households in the top 5% earn nearly $250,000 per year, which is more than 10 times what households in the 20th percentile earn.
Pool ownership in Los Angeles is therefore more than a lifestyle marker – it functions as a visible proxy for income inequality.
Pool construction surged during the pandemic, culminating in a historic peak in 2022. That year, the City of Los Angeles permitted 3,041 pools, marking the highest annual total on record.
Since then, demand has begun to cool. In the first half of the most recent year, the city issued 1,147 permits, which represents a 25% decline compared to the same period in 2022.
At the same time, economic pressures are mounting. A basic backyard pool cost roughly $50,000 a decade ago, whereas today that figure commonly exceeds $100,000. Tariffs have added 10–15% to equipment costs, including essential components like pool pumps, and labor shortages are further affecting construction timelines.
Permit activity also reveals where demand is concentrated. Between 2020 and July 31, 2025, Sherman Oaks led the city with 940 pool permits, followed by Chatsworth with 882, Encino with 845, Brentwood with 742, Woodland Hills with 716, Pacific Palisades with 624, and Studio City with 562.
Looking at a longer time horizon, Sherman Oaks stands out even more. Over the past 20 years, the neighborhood has received 3,244 permits, while Brentwood contains 1,920 pools, underscoring its long-standing concentration of residential swimming pools.
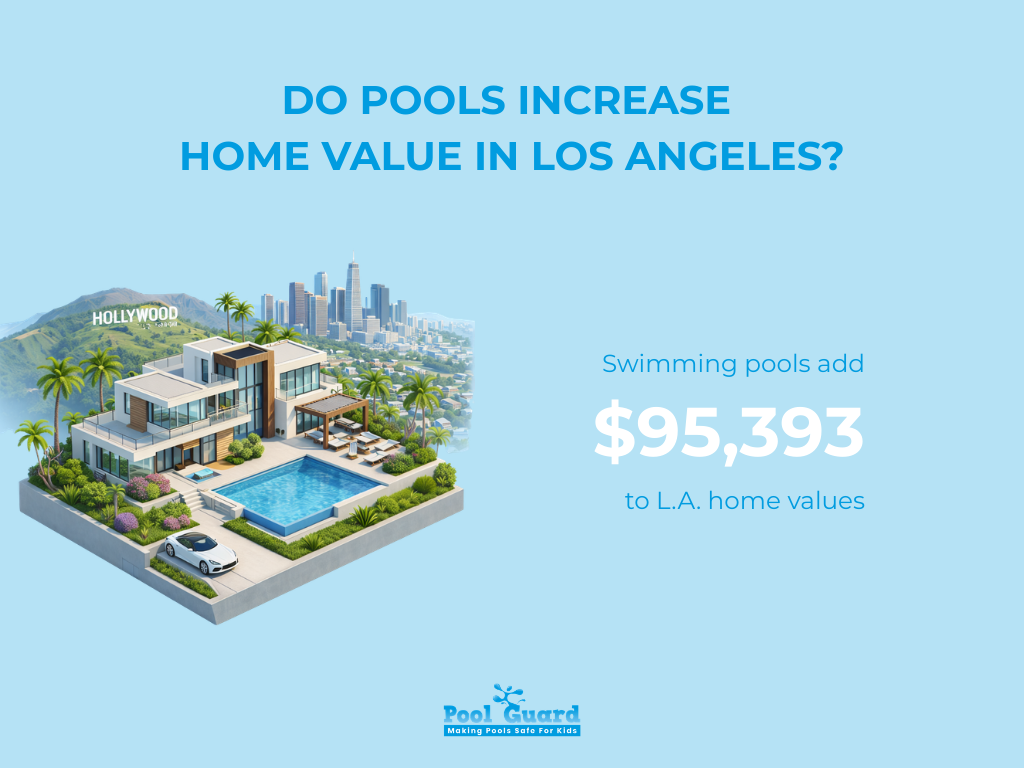
According to a Redfin analysis, pools in Los Angeles add $95,393 to a typical home’s value. To put that into perspective, the same feature adds only $11,591 in Phoenix, highlighting just how differently pools are valued depending on geography and climate.
In Los Angeles specifically, in-ground pools can increase home value anywhere from 5% to 56%, producing a return on investment within that same 5%–56% range. Because Los Angeles enjoys year-round warmth and a Mediterranean climate, resale performance tends to land toward the higher end of that spectrum compared to colder markets where pools are seasonal amenities.
The tax implications are also measurable. For example, if a home’s value rises from $700,000 to $800,000 after installing a pool, property taxes – based on California’s 1% rate – would increase from $7,000 to $8,000 annually.
Pools have the most significant resale impact in the $700,000 to $1 million price range, where buyers expect outdoor amenities and where ongoing maintenance costs represent a smaller percentage of overall property value. In this segment of the Los Angeles housing market, a pool shifts from being a luxury bonus to a competitive necessity.
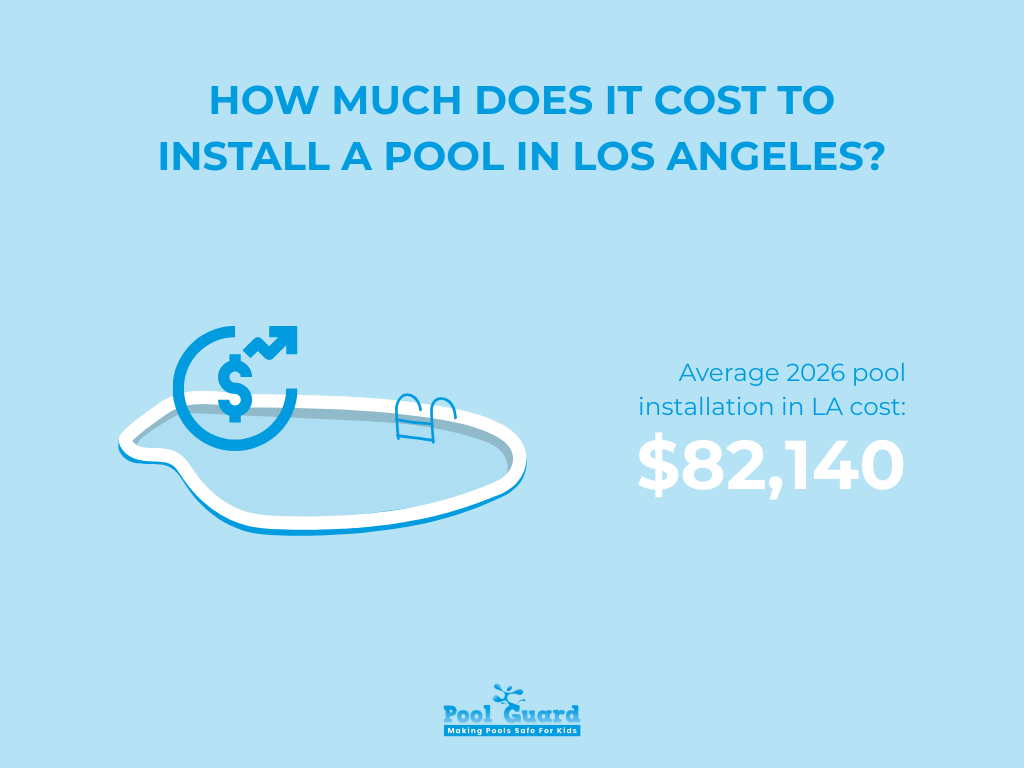
Installing an in-ground pool in Los Angeles requires a significant investment. In 2026, the average cost is $82,140, with most homeowners spending between $58,880 and $105,400. At the lower end, projects can start around $25,000, while high-end custom builds can reach $150,000.
The type of material you choose plays a major role in total cost. In Los Angeles, pricing typically falls within the following ranges:
Concrete pools offer the highest customization and durability but come at the highest price point. Fiberglass provides a mid-range option, while vinyl is generally the most affordable upfront.
It’s also important to factor in Los Angeles’ 9.75% sales tax, which increases material costs compared to many other regions.
In Los Angeles, in-ground pools cost roughly $90 to $250 per square foot, depending on complexity and materials.
For example:
As size increases, excavation, structural reinforcement, plumbing, and finishing costs scale accordingly.
Labor is a substantial portion of the budget in Los Angeles, accounting for 25% to 50% of the total project cost. Contractors may charge $55 to $150 per hour, depending on expertise and scope.
Permit costs begin at $37.33, though additional fees may apply depending on project specifications. Excavation alone can range between $500 and $3,020, depending on soil conditions and accessibility.
Local building code requirements also add to overall planning considerations.
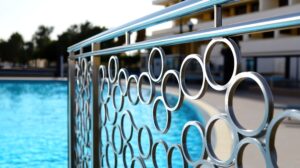
In Los Angeles, residential pool installations must include:
These safety measures are mandatory and should be factored into both cost and design from the outset.
Owning a pool comes with ongoing maintenance financial responsibilities that vary depending on usage, repairs, and equipment condition. Annual maintenance costs in Los Angeles can range significantly.
If major repairs are required, homeowners typically spend between $3,000 and $5,000 per year. However, in years without significant issues, minimal maintenance expenses can fall as low as $116 to $354 annually.
National averages provide additional context. Across the United States, annual pool ownership costs generally range from $3,030 to $5,995, including chemicals, electricity, water, and repairs. These figures reflect the full operational expense of keeping a pool clean, safe, and functioning properly.
Because Los Angeles has a year-round Mediterranean climate characterized by hot, dry summers and mild, wet winters, pools in the region tend to see higher utilization rates than in many other U.S. markets. Increased usage can influence maintenance frequency and long-term wear on equipment.
Pools in Los Angeles are more than amenities – they are economic indicators, lifestyle investments, and real estate multipliers.
If you want more swimming pool statistics – including national trends, accident data, and long-term market forecasts – explore our full data-driven resources here
Los Angeles pool statistics tell a story of climate, wealth, urban density, and shifting housing economics. From 43,123 mapped backyard pools to a $95,000 value boost per home, pools are deeply woven into the city’s identity.
If you’re considering installing a pool – or safeguarding one – you now have the data to make an informed decision.
Explore our related resources at Pool Guard USA to ensure your pool investment is safe, compliant, and protected.
Please fill out the form below with your information. Your local dealer will be notified about your inquiry.
Please fill out the form below with your information. Your local dealer will be notified about your inquiry.