Tucson is one of the hottest cities in America — and that reality shapes everything about pool ownership, public swimming access, and water consumption.
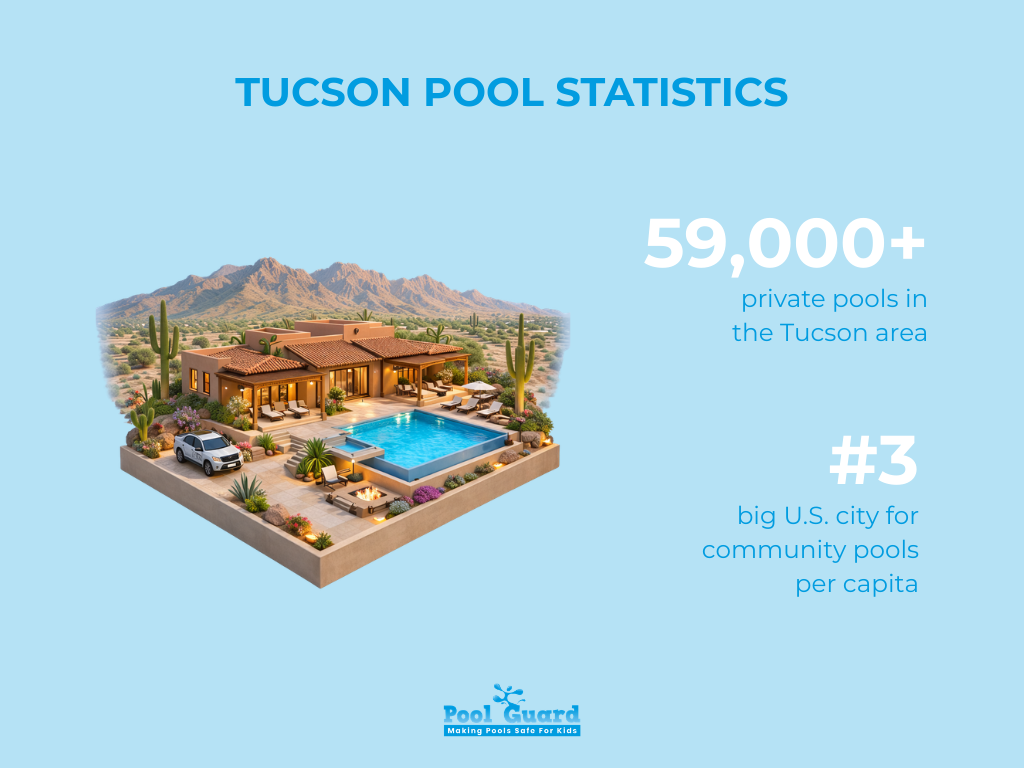
From ranking No. 3 among the 100 largest U.S. cities for community pools per capita to having more than 59,000 private residential pools, Tucson’s pool landscape tells a powerful story about climate, infrastructure, and economics.
In this complete, data-driven guide on pool statistics for Tucson, we merge public data, city reports, utility figures, and budget insights to give you:
If you care about safety, sustainability, or long-term costs, these numbers matter.
Before diving deeper, here’s a snapshot of the most important pool statistics for Tucson residents should know:
These aren’t just statistics – they shape the future of pool access, safety, and affordability in Tucson.
If you want more detailed pool statistics, historical comparisons, and deeper analysis on how these numbers affect homeowners and policymakers, continue through the sections below —we break down the major trends influencing pool ownership, public aquatics, and water use across the United States.
Tucson stands out nationally for its public aquatic infrastructure. According to the Trust for Public Land’s annual report evaluating the 100 largest U.S. cities, Tucson ranks No. 3 in the country for community pools per capita. The city operates seven swimming pools per 100,000 residents, for a total of 38 public swimming pools.
In a region where summer temperatures regularly exceed 100°F and Tucson is described as the third hottest city during summer months, access to public pools is not recreational excess — it functions as essential heat-response infrastructure. That national ranking reflects a deliberate investment in public aquatic access, even as overall park funding has declined in recent years.
Tucson’s aquatic system is structured across year-round facilities, extended-season pools, summer-only pools, and splash pads that operate during peak heat months.
Five facilities operate throughout the year:
The Edith Ball Adaptive Recreation Center is particularly significant as it houses the city’s only fully accessible pool designed for individuals with certain disabilities. Last year alone, it recorded 15,000 visitors, underscoring the social importance of maintaining consistent operating hours.
Three facilities operate beyond summer months:
These extended-season pools provide critical relief during Tucson’s long shoulder seasons when temperatures remain elevated well into fall.
During peak summer months, the city expands operations to include:
Amphitheater, El Pueblo, Freedom, Himmel, Jacobs, Jesse Owens, Kennedy, Menlo, Oury, Palo Verde, Purple Heart, and Thompson (formerly Mansfield).
This seasonal scaling reflects demand patterns tied directly to extreme heat exposure.
Splash pads operate from April 1 through October 31, and admission to all pools and splash pads in Tucson is free. Slides and diving boards are available from June through August.
There are 12 splash pad locations, including Barrio Nopal, Catalina Park, Fort Lowell, Udall, Jesse Owens, Purple Heart, and Gunny Barreras (closed for the 2025 season for maintenance and repairs).
However, in national comparisons Tucson ranks only 64th among the 100 largest cities for splash pad availability, with just three splash pads counted in the national comparison dataset. While splash pads are often more water-efficient and simpler to install than traditional swimming pools, Tucson’s infrastructure in this category remains limited relative to its public pool density.
Despite its strong per-capita ranking, Tucson’s public aquatics system faces financial strain.
In 2024, the Parks and Recreation Department reduced pool hours by 37% after overspending on extended pool hours and program expansions the previous summer. In 2023, city pools were open a combined 802 hours per week. The revised 2024 core schedule runs from June 1 through July 31, with reduced operating hours across facilities.
City officials identified a $200,000 aquatics program shortfall needed to restore hours. Leadership indicated it may be possible to increase pool access by 29 additional hours per week in selected facilities if funding solutions are approved.
These reductions triggered public concern, particularly because of Tucson’s extreme summer heat and the reliance of vulnerable communities on public aquatic access.
Public pools represent only part of Tucson’s aquatic landscape. The larger story — and arguably the more consequential one — lies in private residential ownership.
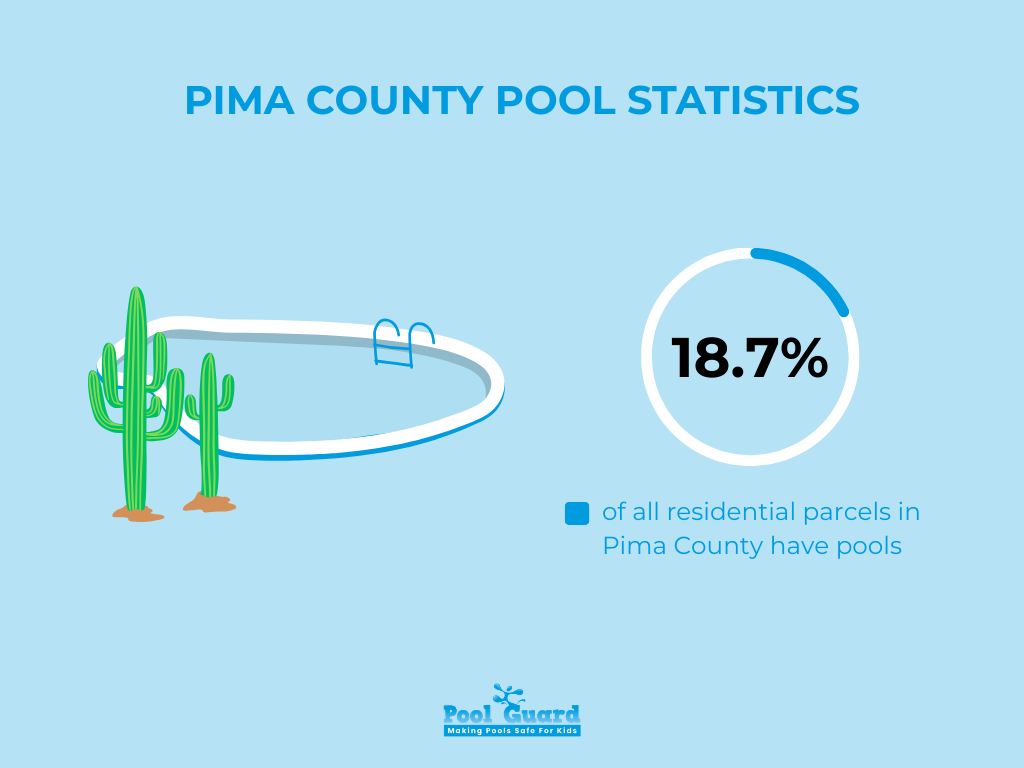
As of December 2024, the Tucson area has more than 59,000 private swimming pools, representing 18.7% of all residential parcels in Pima County. In practical terms, that means nearly one in five homes has a backyard pool.
That level of saturation is significant for a desert metro area. It affects municipal water demand, energy consumption, real estate value dynamics, and long-term sustainability planning.
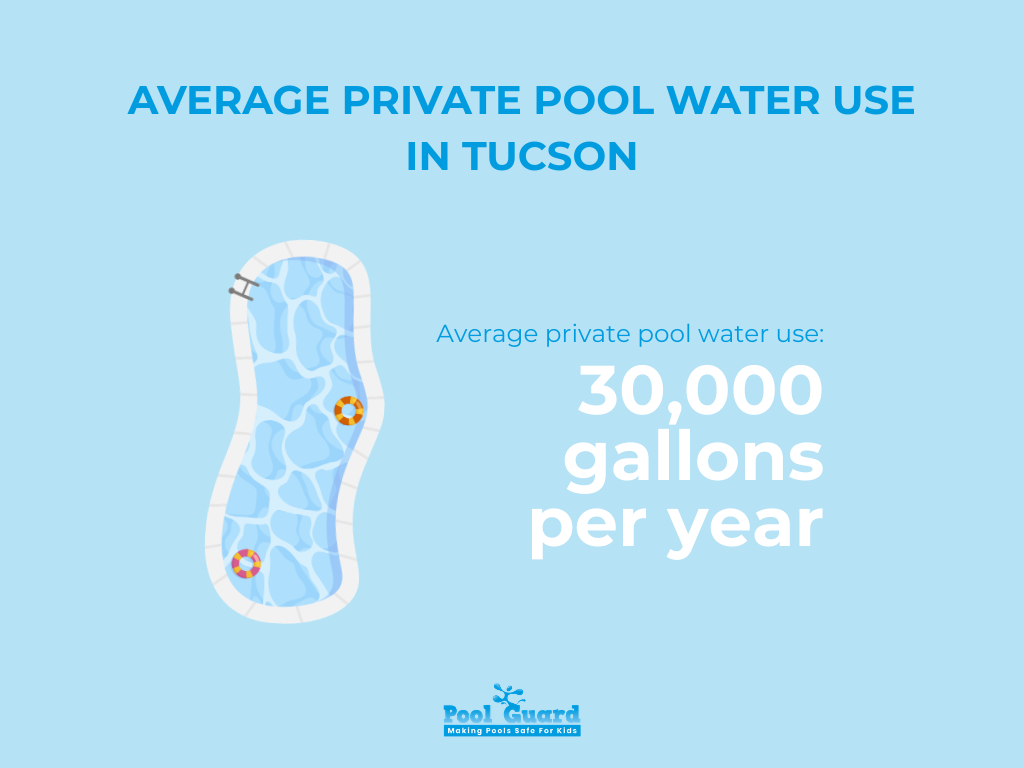
The average private pool in Tucson uses approximately 30,000 gallons of water per year. That figure is striking when placed in context: it represents nearly half of the annual water consumption of the average Tucson Water household.
In a region where long-term water sustainability remains a structural concern, this baseline consumption level carries weight. Unlike discretionary luxury upgrades, pools require ongoing evaporation replacement, chemical balancing, and periodic refilling — especially during extreme summer heat.
The financial reality of pool ownership becomes clearer when examining documented homeowner cases.
One Catalina Foothills homeowner calculated annual pool-related costs at approximately $3,500 per year, accounting for water, electricity, chemicals, and routine maintenance. During seasonal refills, her water bill rose to $900 for the month, compared to a typical summer bill ranging from $400 to $500. The spike occurred under Tucson Water’s increasing block rate structure, where per-gallon costs rise as consumption increases.
After removing her pool at a cost of $10,000, she projected that energy, water, and maintenance savings would offset the removal expense within three years.
Another Tucson homeowner who removed his pool reported measurable usage reductions:
His pool removal expenses totaled approximately:
He calculated full cost recovery within two and a half years. At one point, he determined his “cost per swim” was roughly $250 per dip, highlighting the disconnect between ownership perception and usage frequency.
These figures are not projections. They are documented post-removal outcomes.
A 2017 survey of 300 pool owners within the Tucson Water service area found that 1 in 6 homeowners (17%) were considering removing their pools. That level of reconsideration suggests underlying dissatisfaction driven by maintenance burdens, rising costs, and environmental awareness.
The market has responded. There are now at least 10 Tucson-based businesses specializing in pool removals, reflecting sustained demand.
When nearly 60,000 private pools consume 30,000 gallons each annually, the aggregate water impact becomes significant. At scale, this represents billions of gallons circulating through residential systems every year.
For homeowners, the decision becomes personal economics. For policymakers, it becomes infrastructure forecasting. For safety providers and pool industry leaders, it becomes a long-term strategic conversation.
This is why private ownership trends are central to understanding pool statistics for Tucson — they shape both household finances and citywide resource planning.
Owning a pool in Tucson is often framed as a lifestyle upgrade. The data tells a more complex story — one that blends annual maintenance costs, infrastructure aging, water pricing structures, and eventual removal considerations.
When evaluating pool statistics for Tucson, cost analysis becomes unavoidable.
A documented example from a Catalina Foothills homeowner illustrates the recurring financial commitment tied to private pool ownership. Her total annual pool-related expenses averaged approximately $3,500 per year, covering:
These recurring costs do not include capital improvements such as resurfacing, structural repairs, or equipment upgrades. They represent standard operational expenses for an actively maintained residential pool in Tucson’s climate.
Because Tucson Water uses an increasing block rate structure — meaning per-gallon prices rise as usage increases — seasonal refilling can significantly elevate household bills. In this case, during a refill month, the homeowner’s water bill climbed to $900, compared to a typical summer bill of $400 to $500.
That spike was not an anomaly. It was a predictable outcome of evaporation rates in extreme heat combined with tiered water pricing.
Beyond annual maintenance, aging pools introduce larger financial decisions.
Replastering and major rehabilitation estimates for older pools in Tucson range from $7,000 to $12,000, depending on condition and scope.
For some homeowners, removal becomes the economically rational alternative.
One Tucson homeowner reported the following removal expenses:
Total: $6,500.
He calculated full cost recovery within two and a half years, based on reduced water, sewer, electricity, and maintenance expenses.
Another homeowner spent $10,000 on removal and projected full payback within three years.
Perhaps the most striking metric came from a former owner who calculated his “cost per dip” at approximately $250 per swim — a figure derived from total operating expenses divided by actual usage. That calculation reframes the luxury narrative into a measurable cost-per-use analysis.
Financial and maintenance pressures are not isolated experiences.
A 2017 survey of 300 pool owners within the Tucson Water service area found that 1 in 6 homeowners (17%) were considering removing their pool.
Reported motivations included:
The market response is visible: there are now at least 10 Tucson-based businesses specializing in pool removals, indicating sustained demand rather than isolated cases.
When nearly one in five residential parcels contains a pool and 17% of surveyed owners have contemplated removal, that signals structural reconsideration — not mere anecdotal dissatisfaction.
For homeowners, the decision often hinges on three questions:
Beyond operating costs and water use, homeowners must also consider resale value. While pools can boost appeal in Tucson’s hot climate, the added home value often depends heavily on neighborhood expectations and buyer preferences.
Tucson is widely described as the third hottest city in the United States during summer, with many days exceeding 100°F. In that kind of climate, pools are not simply recreational amenities — they function as critical cooling infrastructure for families and communities.
At the same time, pools are water-intensive assets in a desert region where long-term conservation remains a priority. Maintaining thousands of public and private pools requires significant water allocation, especially during peak evaporation months.
This creates a balancing act between public health needs, water conservation goals, municipal budget responsibility, and homeowner economics. That tension ultimately shapes the future direction of pool statistics for Tucson and how aquatic resources are managed in the years ahead.
Developers planning new public or semipublic aquatic facilities in Pima County move through a clearly structured approval process. Applications are typically processed within one business day, and administrative reviews are completed within a few business hours once submitted.
Substantive plan reviews are often finalized within two business hours, provided all required documentation meets code standards. However, final inspections must be scheduled at least 72 hours in advance, and utilities and equipment must be fully operational before approval is granted.
Before opening, operators are also required to obtain an official license through the Pima County Health Department. While approval timelines are relatively fast compared to many jurisdictions, compliance standards remain strict and non-negotiable.
The next decade of pool statistics for Tucson will be shaped by three defining forces: increasing pressure around water sustainability, tightening municipal budgets, and the evolving economics of private pool ownership.
Water sustainability remains central in a desert climate where evaporation rates are high and nearly 60,000 private pools require ongoing replenishment. At the same time, the city faces projected budget deficits, which place added scrutiny on public aquatics funding and operational hours. Meanwhile, homeowners are making more data-driven decisions as they weigh annual maintenance costs, energy use, and long-term return on investment.
With fiscal strain on public facilities and rising operational costs for private owners, Tucson is approaching an inflection point. In the coming years, we can reasonably expect continued efficiency upgrades such as high-efficiency pumps and pool covers, steady demand for pool removal services, renewed debate over potential rebate programs, and greater evaluation of water-intensive amenities.
Rather than signaling decline, these trends point toward modernization. The future of Tucson’s pool landscape will likely be defined by smarter water management, improved safety standards, and financially sustainable infrastructure planning.
Tucson combines one of the highest public pool densities in the U.S. with nearly 60,000 private residential pools – a rare and powerful mix shaped by extreme summer heat and strong community demand.
Rising water costs, maintenance expenses, and budget pressures aren’t signs of decline. They’re pushing homeowners and city leaders toward smarter, more efficient decisions. From upgraded equipment and better water management to thoughtful long-term planning, the shift is toward optimization – not elimination.
Understanding pool statistics for Tucson gives you leverage. With the right data, you can reduce costs, improve safety, and make confident, forward-looking choices.
The landscape is evolving – and for informed pool owners and communities, that’s an opportunity.
Please fill out the form below with your information. Your local dealer will be notified about your inquiry.
Please fill out the form below with your information. Your local dealer will be notified about your inquiry.