Atlanta is one of the most pool-active metro areas in the American Southeast — and the numbers prove it. With nearly 190,000 residential pools spread across a 24-county metro region, greater Atlanta sits firmly in the upper tier of Sun Belt pool markets. Yet unlike Miami or Phoenix, Atlanta’s pool landscape is shaped by a unique mix of rolling topography, dense tree cover, four-season climate, and rapid suburban sprawl.
This guide consolidates the most current data available — including HBW construction permit records through Q3 2025, national market research from the Pool & Hot Tub Alliance, and Redfin property value analysis — into a single authoritative resource for homeowners, real estate professionals, pool contractors, and safety advocates operating in the Atlanta market.
Whether you’re deciding whether to build a pool, sell a home with one, or simply understand how Atlanta’s pool market compares nationally, the data below gives you a grounded, honest picture.
Georgia has an estimated 190,000 residential swimming pools statewide, according to data compiled by PoolResearch.com — roughly one pool for every 55 residents. That places Georgia in the middle tier nationally, ahead of colder states like Colorado (1 per 109 residents) but well behind Florida (1 per 14) and Arizona (1 per 13).
Within the Metro Atlanta region, pool density is highly uneven. The pattern is consistent: pool ownership increases with suburban distance from the urban core.
Compared to other Southeast metros, Atlanta’s pool density is moderate but growing. Charlotte and Nashville have lower per-capita pool rates due to shorter warm seasons. Dallas and Houston exceed Atlanta in total pool counts but have fewer affordability-driven constraints.
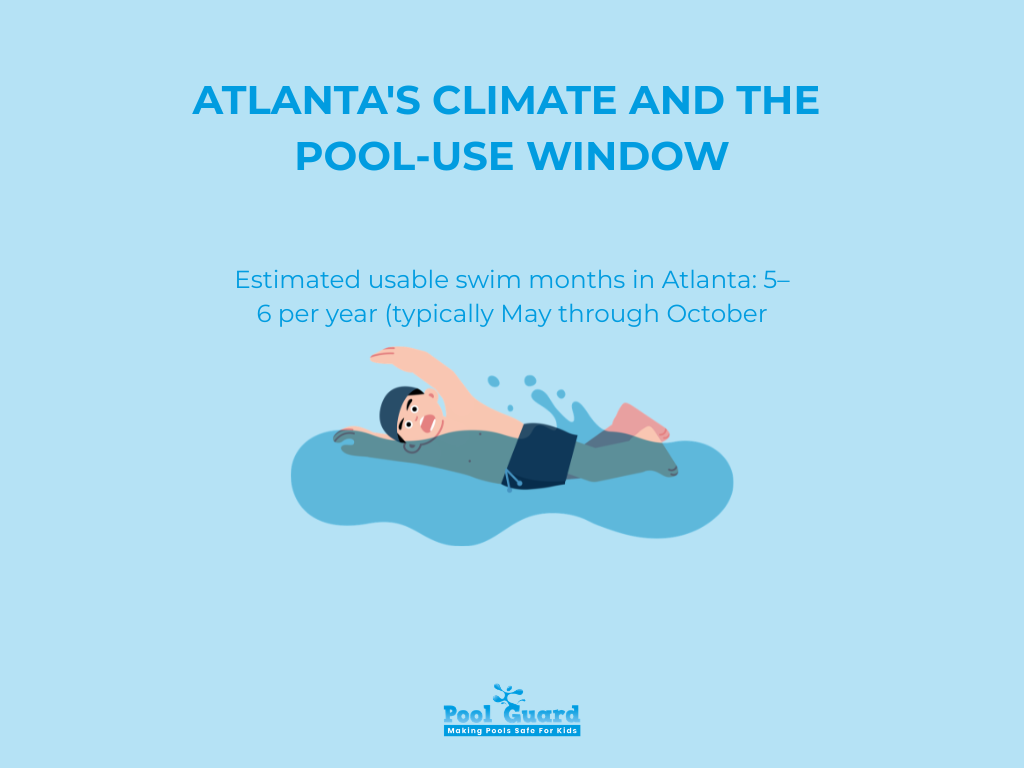
Atlanta sits in a humid subtropical climate zone (Köppen Cfa), with long, hot, humid summers and mild but real winters. That climate profile supports a meaningful pool season — but a shorter one than Florida or coastal Texas.
Estimated usable swim months in Atlanta: 5–6 per year (typically May through October, with shoulder use in April and late October depending on heating).
Key climate benchmarks:
By comparison, Florida’s Tampa market enjoys 8–9 usable pool months annually, and Phoenix averages 9–10 months despite its desert location. This shorter window is a real factor in Atlanta’s pool ROI calculus — a pool used 5 months a year amortizes differently than one used year-round.
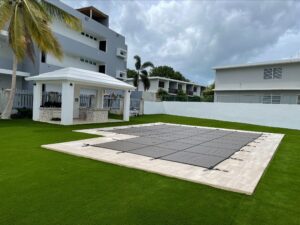
That said, pool heaters extend the Atlanta season meaningfully. Solar pool heating systems average $3,000–$4,000 nationally, and gas or heat pump systems are widely used in Metro Atlanta to push the season from late March through November.
The most granular picture of Atlanta’s pool construction activity comes from HBW’s permit database, which tracks all 24 Metro Atlanta counties.
Full-year permit context:
| Year | YOY Change |
| 2022 | -8% |
| 2023 | -26% |
| 2024 | -13% |
| 2025 (Q1–Q3) | -2% |
After a sharp post-pandemic correction — permit volumes fell dramatically in 2023 as interest rates climbed and material costs remained elevated — the market is clearly stabilizing. The -2% figure through Q3 2025 is the smallest YOY decline in three years, and several outlying counties are now growing again.
2025 quarterly breakdown:
Top 6 counties by permit volume (Q3 YTD 2025):
| County | Permits (YTD) | YOY Trend |
| Fulton | 387 | Slight decline |
| Cobb | 205 | Declining |
| Cherokee | 195 | +13% |
| Forsyth | 165 | +9% |
| Gwinnett | 145 | Stable |
| Coweta | 141 | +30% (H1) |
The emerging pattern: demand is redistributing outward. Established urban-adjacent counties (Fulton, Cobb) are softening as affordability constraints bite, while outer suburban counties with newer housing stock and larger lots (Cherokee, Coweta, Walton) are picking up steam.
Atlanta’s residential pools tend to reflect the suburban character of the neighborhoods they’re built in.
Typical pool dimensions in Atlanta-area homes:
Atlanta’s topography is a significant design factor that distinguishes it from flat-terrain markets like Tampa or Houston. The Piedmont region’s rolling hills mean that many Atlanta backyards require:
This terrain complexity adds construction cost and time relative to flat-site builds. It also influences pool shape — rectangular pools are harder to adapt to irregular sloped lots, pushing many Atlanta builds toward freeform or L-shaped designs.
Dense tree coverage is another Atlanta-specific maintenance driver. Pines, oaks, and dogwoods drop year-round debris, increasing the demand for pool covers, robotic cleaners, and more frequent professional service visits compared to less-wooded markets.
National averages provide a useful baseline, but Atlanta has its own cost profile shaped by labor markets, terrain, and regional material pricing.
National average cost of an in-ground pool (2026): $65,000
In Metro Atlanta, costs typically align with or slightly exceed national averages due to:
Cost ranges by pool type (applicable to Atlanta market):
| Pool Type | Typical Cost Range |
| Concrete | $65,000 – $120,000+ |
| Fiberglass | $55,000 – $100,000 |
| Vinyl Liner | $40,000 – $75,000 |
Cost by size:
| Pool Size | Average Build Cost |
| 12×24 ft | $22,000 – $35,000 |
| 16×32 ft | $40,000 – $65,000 |
| 20×40 ft | $65,000 – $100,000 |
Annual maintenance costs in Atlanta: $3,030 – $5,995
Atlanta’s humid climate creates specific maintenance pressures: algae growth accelerates in warm, humid conditions, increasing chemical demand. Heavy pollen seasons (Atlanta ranks among the highest-pollen cities in the US) add filtration and cleaning load. Expect maintenance costs at or above the national midpoint.
| Expense | Annual Cost |
| Maintenance services | $960 – $1,800 |
| Chemicals | $175 – $750 |
| Electricity | $800 – $1,200 |
| Water | $45 – $245 |
| Repairs | $400 – $1,000+ |
| Opening & closing | $650 – $1,000 |
Americans collectively spend roughly $1 million every hour on pool construction, maintenance, and cleaning nationwide — and Atlanta’s active pool market represents a meaningful share of that figure.
According to Redfin’s analysis of metro-level pool premiums, a pool adds an average of $26,483 to a typical Atlanta home’s value — placing Atlanta in the mid-range nationally.
For context:
| Metro Area | Pool Value Added |
| Los Angeles | $95,393 |
| Austin | $52,228 |
| Houston | $35,736 |
| Charlotte | $34,917 |
| Atlanta | $26,483 |
| Orlando | $21,300 |
| Phoenix | $11,591 |
With a national average in-ground pool costing $65,000 to build, Atlanta homeowners typically do not fully recoup construction costs through resale value alone. The $26,483 premium represents roughly 41 cents on the dollar relative to the average build cost.
However, several nuances apply in the Atlanta market:
When a pool adds the most value in Atlanta:
When a pool may not add value:
Real estate professionals in the Atlanta market consistently note that a well-maintained, appropriately sized pool in the right neighborhood is a genuine value driver — but an aging pool in a price-sensitive neighborhood can actually reduce buyer interest.
Not all of Atlanta’s pool activity is in private backyards. The metro area has a robust ecosystem of shared-use aquatic amenities.
Pool safety is not a peripheral concern — it is a public health issue, and the data demands attention.
Nationally, 379 children under age 15 die in pool or spa-related drownings each year, according to the U.S. Consumer Product Safety Commission. Of those fatalities:
Drowning is the leading cause of unintentional death for children ages 1–4 (excluding birth defects) and the second leading cause for children ages 1–14.
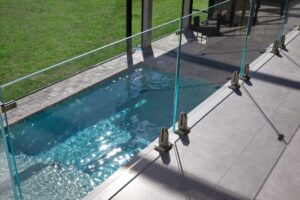
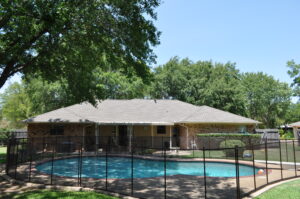
In Georgia and Metro Atlanta, the risk profile mirrors national patterns, with private residential pools accounting for the majority of incidents. Several Georgia counties, including those in Metro Atlanta, have four-sided pool fencing requirements as part of building permits — but enforcement and compliance vary.
Key risk reduction data:
For Atlanta families, Pool Guard USA recommends reviewing your county’s specific fencing and barrier requirements at permit time — and treating certified CPR training and formal swim lessons as non-negotiable complements to pool ownership.
How does Atlanta compare to peer metros in the Southeast?
| Metro | Pool Est. | Climate | Avg. Swim Months | Pool Value Premium |
| Atlanta | ~190,000 | Humid subtropical | 5–6 | $26,483 |
| Charlotte | Lower | Humid subtropical | 4–5 | $34,917 |
| Nashville | Lower | Humid subtropical | 4–5 | Not reported |
| Orlando | Very high | Tropical | 10–11 | $21,300 |
| Dallas | ~400,000+ | Semi-arid | 7–8 | Data varies |
| Houston | ~350,000+ | Humid subtropical | 7–8 | $35,736 |
Atlanta’s pool market sits at an interesting inflection point. It has a longer swim season than Charlotte or Nashville, justifying greater investment. But it falls short of Florida and Texas in both climate suitability and per-capita ownership, which keeps the value premium moderate.
What Atlanta does have that Orlando and Houston lack: strong suburban growth corridors driving consistent new construction demand, particularly in the northern counties. The Cherokee and Forsyth corridor growth in 2025 reflects Atlanta’s broader demographic expansion northward — and pool permits are following homebuilding activity closely.
The pool service sector in Metro Atlanta is substantial and growing. With nearly 190,000 residential pools requiring year-round care — combined with Atlanta’s specific maintenance challenges — the region supports a dense network of service providers.
Factors driving above-average maintenance demand in Atlanta:
These conditions make consistent professional service more valuable in Atlanta than in drier markets. Pool service companies in Metro Atlanta tend to offer more comprehensive leaf and debris management packages than their counterparts in Arizona or Nevada markets.
The pool construction and service industry represents a significant component of Atlanta’s broader home services economy. National pool industry revenue was approximately $1.1 billion annually as of the most recent data, with the U.S. market projected to reach $2 billion in 2025 — an 8.4% compound annual growth rate over five years.
Atlanta’s pool market tells a story of suburban growth, climate-driven demand, and gradual post-pandemic stabilization. The data points to a market where pools remain valued residential amenities — particularly in the outer suburban counties experiencing the most new construction — but where investment decisions deserve careful attention to county-specific trends, home price tier, and long-term ownership costs.
If you found this guide useful, share it with a neighbor, a client, or a colleague evaluating a pool project in the Atlanta area. For more resources on pool safety, barrier requirements, and protection solutions, explore Pool Guard USA’s full resource library.
https://blog.hbweekly.com/metro-atlanta-swimming-pool-construction-trends-through-q3-2025
https://blog.hbweekly.com/atlanta-swimming-pool-construction-holds-steady-through-q2-2025
https://www.foxessellfaster.com/blog/a-comprehensive-guide-to-2026-swimming-pool-statistics
https://www.axios.com/local/atlanta/2025/06/24/metro-atlanta-homes-30-now-offer-pools
Please fill out the form below with your information. Your local dealer will be notified about your inquiry.
Please fill out the form below with your information. Your local dealer will be notified about your inquiry.