San Antonio is one of Texas’ largest residential pool markets, shaped by a long hot season, expansive suburban development, and a housing stock dominated by single-family homes. Pools are common across many parts of the metro area, particularly in outer-loop neighborhoods built during rapid population growth periods.
In San Antonio, the combination of scorching summers, large suburban lots, and outdoor-centric lifestyles has made backyard pools a defining feature of many neighborhoods. While some cities rely heavily on resort or tourism pools, San Antonio’s aquatic landscape is largely residential and community-driven.
This guide presents San Antonio Pool Statistics covering residential ownership rates, climate-driven usage patterns, pool sizes, construction trends, municipal aquatic infrastructure, and the broader industry ecosystem supporting pool ownership across Bexar County.
1. How Many Homes in San Antonio Have Swimming Pools?
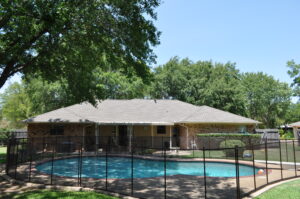
Residential pool ownership varies widely across the San Antonio metro area, largely depending on neighborhood type, lot size, and household income. Suburban areas with larger yards typically have far higher pool densities than urban neighborhoods closer to downtown.
Across Bexar County, swimming pools are a visible but not universal feature of the housing stock. Most installations occur in single-family homes rather than multifamily housing.
Key San Antonio Pool Ownership Statistics
- Approximately 8–12% of single-family homes in Bexar County have residential swimming pools.
- Pool ownership within San Antonio city limits typically ranges between 6–9%.
- Higher-income suburban areas such as Stone Oak and North Side communities can reach 15–25% ownership rates.
- West-side growth areas such as Alamo Ranch average around 10–15% ownership.
- Eastern suburban areas including Converse typically range between 4–7% ownership.
- Nationally, more than 5 million residential in-ground pools exist across the United States.
Compared with other large Texas metros, San Antonio sits in the middle of the state’s residential pool ownership spectrum.

Texas Market Comparison
- Houston pool ownership is estimated between 15–20%.
- Dallas–Fort Worth pool ownership ranges roughly between 10–15%.
- Austin pool ownership generally falls between 12–16%.
- San Antonio averages between 8–12%.
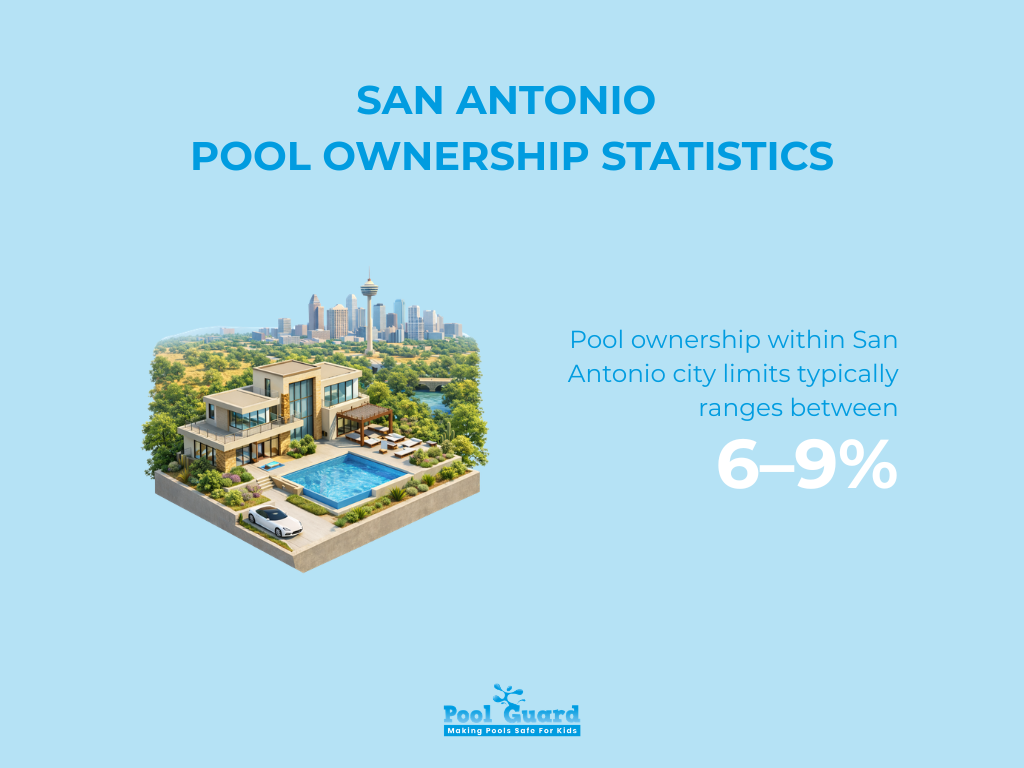
San Antonio’s slightly lower rate is largely explained by income distribution and military housing turnover rather than climate limitations.
2. Climate and Pool Season Length in San Antonio
Climate is one of the strongest drivers behind San Antonio pool statistics. Summers in the region are long, hot, and frequently humid, making swimming pools a practical cooling solution rather than simply a luxury amenity.
The city experiences extended warm seasons compared with most inland metropolitan areas in the United States.
Climate Statistics That Influence Pool Usage
- Average July daytime temperatures typically range between 95°F and 100°F.
- Heat index values often exceed 105°F during peak summer months.
- San Antonio typically experiences 6–7 months of viable swimming weather each year.
- Outdoor pool season usually runs from April through October.
- Peak swimming demand occurs between June and September.
Compared to other Texas cities:
- San Antonio’s swim season averages roughly 6–7 months annually.
- Dallas typically sees a shorter season of about 5–6 months.
- Houston averages roughly 7–8 swim months due to warmer winters.
The extended warm season contributes significantly to backyard pool demand across suburban neighborhoods.
3. Average Pool Size in San Antonio Backyards
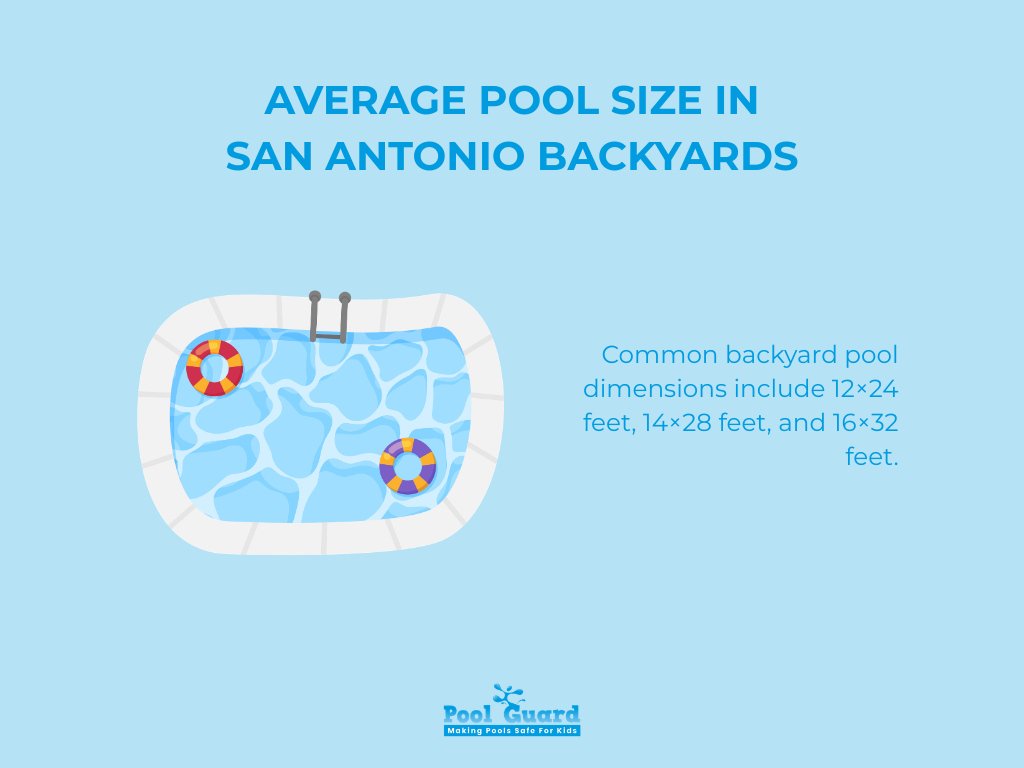
San Antonio backyard pools tend to reflect suburban lot sizes and development eras. Homes built during earlier suburban expansion phases generally feature larger yards, which allows for larger pool installations.
More recent housing developments sometimes include smaller pools due to tighter lot spacing and higher housing density.
Typical Residential Pool Dimensions
- Most residential pools measure between 400 and 800 square feet.
- Typical pool water volume ranges between 10,000 and 20,000 gallons.
- Common backyard pool dimensions include 12×24 feet, 14×28 feet, and 16×32 feet.
- Luxury custom pools in larger estates can exceed 20×40 feet.
Differences between housing eras are noticeable:
- 1980s–1990s subdivisions frequently include larger pools due to deeper backyard lots.
- 2000s suburban developments often feature slightly smaller pools averaging 12×24 feet.
- New master-planned communities increasingly include compact plunge pools or smaller geometric designs.
San Antonio’s suburban housing patterns still allow for larger pool footprints compared with dense cities such as Austin or Los Angeles.

4. Military and Suburban Housing Influence on Pool Ownership
San Antonio’s housing landscape is strongly influenced by the presence of Joint Base San Antonio, one of the largest military installations in the United States.
This military presence affects residential stability, housing demand, and pool installation patterns.
Housing Dynamics Affecting Pool Ownership
- San Antonio is home to one of the largest military populations in the U.S.
- Military-connected households often relocate every 2–4 years.
- Frequent relocation can reduce long-term investments such as pool construction.
- Established homeowner neighborhoods have significantly higher pool installation rates.
- Transient military housing areas typically show lower residential pool ownership.
As a result, the city’s overall pool ownership percentage is slightly lower than some other Sunbelt metros with more stable long-term homeowner populations.
5. Residential Pool Construction Trends in San Antonio
Pool construction in San Antonio tends to follow suburban housing growth cycles. Whenever large numbers of new homes are built, pool installations tend to follow shortly afterward.
The relationship between housing expansion and pool demand has been visible across several major development phases.
Key Pool Construction Statistics
- San Antonio issued approximately 748 residential pool permits in 2021.
- Pool permits declined to roughly 520 permits in 2023.
- As of mid-2024, the city had issued about 232 pool permits.
- National pool construction dropped from about 120,000 pools in 2021 to roughly 60,000 annually.
The pandemic significantly boosted backyard improvement projects, including swimming pools. As travel resumed and interest rates increased, demand cooled slightly.
Despite the slowdown, San Antonio remains a major residential pool market within Texas.
6. Average Cost of Building and Maintaining a Pool in San Antonio
Construction costs have increased dramatically in recent years due to rising material prices, labor shortages, and strong pandemic demand.
Typical Pool Construction Costs
- Basic residential in-ground pools typically start around $50,000.
- Mid-range custom pools often cost between $70,000 and $100,000.
- High-end luxury pools with advanced features can exceed $150,000.
- Average pool installation costs were closer to $40,000 prior to the pandemic.
- Many homeowners now report installation prices above $65,000
Annual Pool Maintenance Costs
- Typical yearly maintenance costs range from $1,200 to $2,000.
- Electric pool pumps can run several hours per day.
- Homes with pools may use over 40% more electricity than homes without pools.
Maintenance costs include chemicals, cleaning, pump electricity, and occasional equipment repairs.
7. Home Value Impact of Pools in San Antonio
Pools can influence resale value, but the impact varies widely depending on neighborhood expectations and property type.
Pool Value Impact Statistics
- Residential pools can increase property values by roughly 5–8% on average.
- In hot climates like Texas, increases may reach 10–15% in some neighborhoods.
- The average San Antonio home value is approximately $256,000.
- An 8% value increase equates to about $20,500 in added property value.
Pools often provide the greatest resale value in suburban neighborhoods where they are already common.
8. HOA, Apartment, and Community Pools Across San Antonio
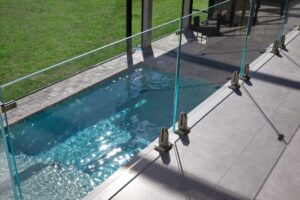
Not every San Antonio resident owns a private pool. Many neighborhoods and housing developments provide shared aquatic facilities.
Shared Pool Infrastructure Statistics
- Hundreds of San Antonio subdivisions maintain HOA-managed community pools.
- Most modern apartment complexes include at least one swimming pool amenity.
- Many large residential developments include splash pads and recreation pools.
- Hotels concentrated near the San Antonio River Walk maintain tourism-focused pools.
While tourism pools exist, the majority of pools in the region are residential or community-managed.
9. Public and Municipal Aquatic Facilities in San Antonio
San Antonio operates an extensive public aquatic system through its parks department.
Municipal Pool Statistics
- The city operates 26 public swimming pools.
- Most outdoor pools operate between May and September.
- Indoor natatoriums operate year-round.
- The largest municipal pool is located at San Pedro Springs Park.
- The San Pedro Springs pool holds approximately 805,000 gallons of water.
Public pools serve tens of thousands of residents each summer and play an important role in providing affordable access to recreation during extreme heat.

10. Pool Service and Maintenance Market in San Antonio
The number of residential pools across the metro area has created a large service industry supporting maintenance, equipment installation, and repairs.
Pool Service Industry Statistics
- Hundreds of pool service businesses operate across the San Antonio metro area.
- Weekly maintenance services are common for many homeowners.
- Hot climate conditions increase the need for chemical balancing and filtration.
- Demand for pool service is strongly correlated with suburban housing density.
Compared to other Texas cities:
- Houston has the largest pool service market in the state.
- Dallas and San Antonio both support large maintenance industries.
- Austin’s market is slightly smaller due to tighter lot sizes.
11. San Antonio Compared to Other Texas Pool Markets
San Antonio’s pool market reflects a combination of climate, suburban growth, and housing affordability.
Regional Pool Market Comparisons
- Houston has the highest pool ownership rates in Texas.
- Dallas has slightly shorter swim seasons due to cooler winters.
- Austin’s denser development patterns limit pool installation space.
- San Antonio benefits from large suburban lots and long summers.
These factors help explain why San Antonio remains a strong residential pool market despite moderate ownership percentages.
Closing Context
These San Antonio pool statistics outline how residential and shared-use pools fit into housing growth, climate conditions, and suburban development across the metro area.
The data highlights several key insights:
- San Antonio’s long warm season supports a 6–7 month swimming window.
- Approximately 8–12% of homes in Bexar County have pools.
- Residential pools typically range between 10,000 and 20,000 gallons.
- Average construction costs now start around $50,000.
- The city maintains 26 public swimming pools serving the community each summer.
Together, these statistics reveal how swimming pools have become embedded in the region’s housing patterns, recreation infrastructure, and outdoor lifestyle.
If you found this guide helpful, consider sharing it or exploring our related resources on pool safety, energy efficiency, and backyard design trends.
Sources:
San Antonio pools reflect a history of exclusion and change
Big Data Analysis of Swimming Pool’s Impact on Household Electric Intensity in San Antonio, Texas
City of San Antonio Public Swimming Pool Energy Efficiency Retrofit Final Report


