A complete, authoritative guide to swimming pools by state, per capita rankings, trends, and what the numbers actually mean.
If you’ve ever flown into Florida and looked down at the endless grid of blue rectangles, you’ve probably asked yourself: what state has the most pools?
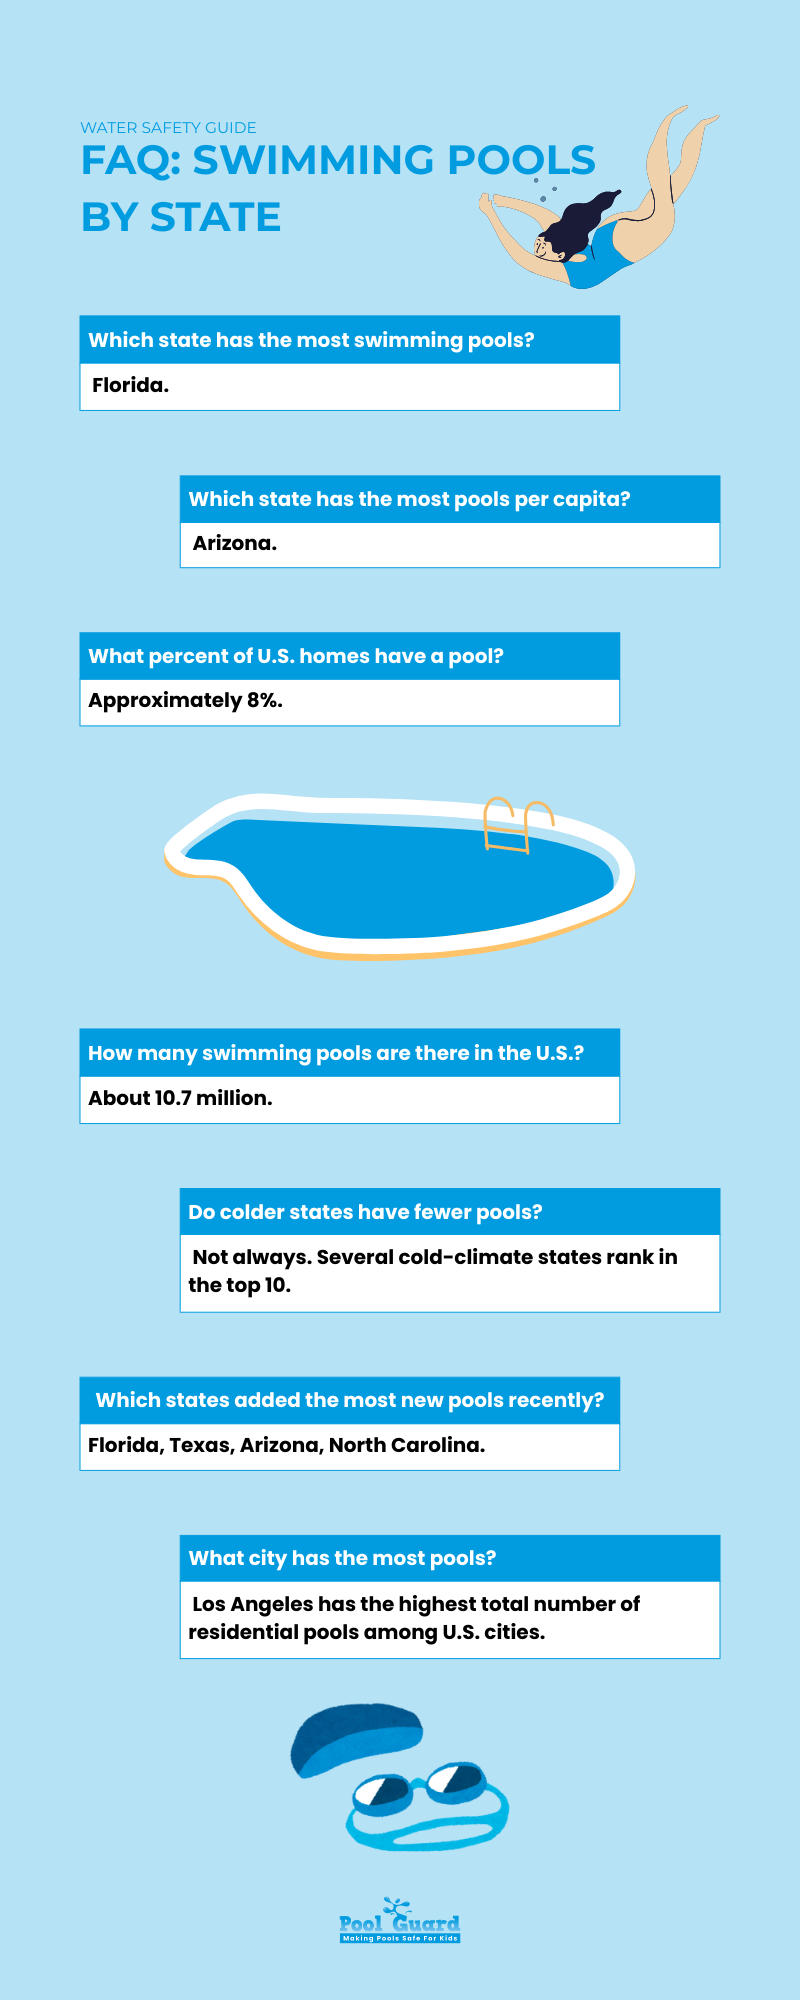
The short answer is Florida – but the real answer is far more interesting, nuanced, and useful.
In this guide, we go far beyond surface-level rankings. Understanding where pools are most common also ties directly into broader trends covered in swimming pool statistics across the United States. You’ll learn:
All data is compiled from authoritative sources including the Pool & Hot Tub Alliance, PoolResearch.com, Angi, Redfin, IBISWorld, CDC, and U.S. Census estimates.
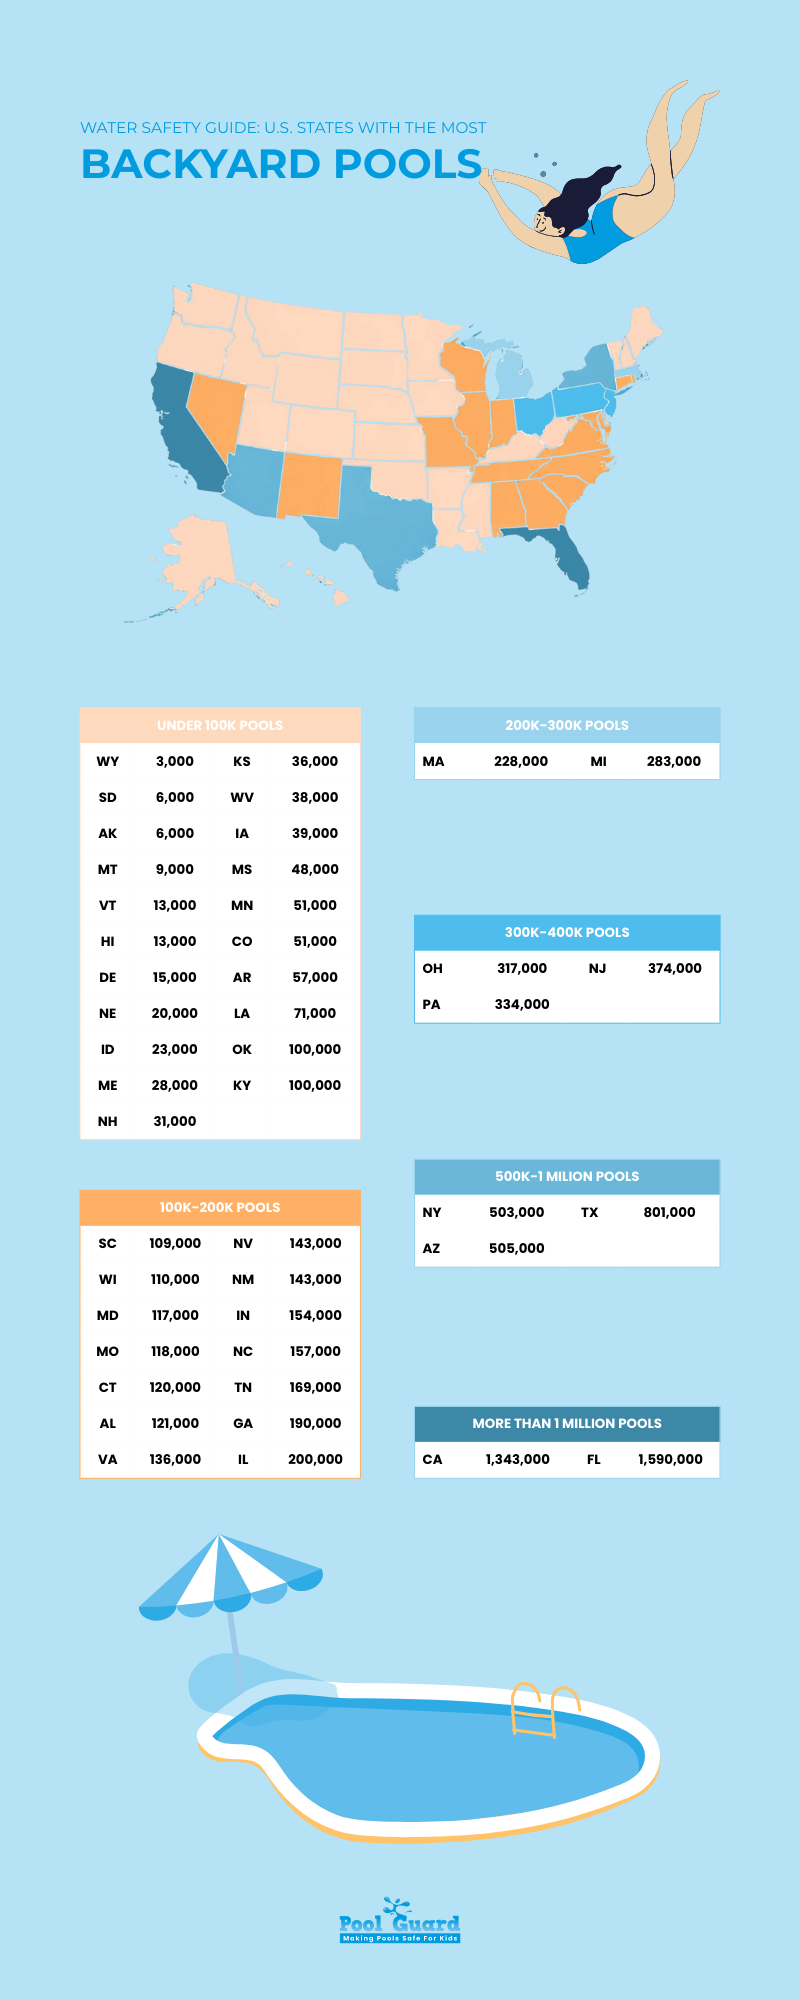
Florida has the most residential swimming pools in the United States.
Florida has held the #1 position for decades and continues to widen the gap.
But total pool count alone doesn’t tell the whole story.
Many of these high-ranking states also appear in localized breakdowns like pool statistics for Houston and other major metros. Below are the states with the highest number of residential swimming pools, ranked by total count.
While total pool count is the most common way to rank states, it only tells part of the story. The table below shows the number of residential swimming pools by state, ranked by total estimated pool count, along with the average number of people per pool. This second metric adds important context by accounting for population size. For example, a state with fewer total pools may still have a higher concentration of pools relative to its population, signaling stronger per-capita pool ownership. Together, these figures highlight both absolute scale (how many pools exist) and relative density (how common pools are within a state). This is why states like Florida and California dominate in total pool count, while Arizona stands out with one of the lowest people-per-pool ratios in the country. By comparing these two columns side by side, readers can better understand not just where the most pools are located, but where pools are most deeply integrated into everyday residential life.
| Rank | State | Estimated Residential Pools | People per Pool |
|---|---|---|---|
| 1 | Florida | 1,590,000 | 14 |
| 2 | California | 1,343,000 | 29 |
| 3 | Texas | 801,000 | 36 |
| 4 | Arizona | 505,000 | 13 |
| 5 | New York | 503,000 | 38 |
| 6 | New Jersey | 374,000 | 24 |
| 7 | Pennsylvania | 334,000 | 38 |
| 8 | Ohio | 317,000 | 37 |
| 9 | Michigan | 283,000 | 35 |
| 10 | Massachusetts | 228,000 | 30 |
Key insight:
Half of the top 10 states are not warm-weather destinations. Pool ownership correlates just as strongly with population density, suburban housing, and household income as it does with climate.
When you adjust for population, the rankings change.
When pool ownership is measured per capita rather than by total count, the rankings shift in a meaningful way. This table highlights the states with the highest concentration of swimming pools relative to population, expressed as the average number of people per pool. A lower number means pools are more common in everyday residential life. Arizona ranks first, narrowly surpassing Florida, with just 13 people per pool, making it the state with the highest pool density per capita in the country. Unlike larger states where population size inflates total pool counts, per-capita rankings reveal where swimming pools are most deeply embedded into residential design and lifestyle. States like New Mexico and Nevada also rank highly despite smaller populations, reinforcing the role of extreme summer heat, suburban development patterns, and limited natural swimming alternatives in driving private pool ownership. By adjusting for population, this view answers a different but equally important question: not just what state has the most swimming pools, but what state has the most swimming pools per capita. These per-capita trends mirror patterns seen in markets like Las Vegas pool ownership and density data.
| Rank | State | People per Pool |
|---|---|---|
| 1 | Arizona | 13 |
| 2 | Florida | 14 |
| 3 | New Mexico | 15 |
| 4 | Nevada | 21 |
| 5 | New Jersey | 24 |
Arizona edges out Florida with the highest pool density per capita, largely due to:
This makes Arizona the answer to a slightly different question: what state has the most swimming pools per capita?
Understanding the total number of swimming pools in the United States helps put state-by-state rankings into context. According to estimates from the Pool & Hot Tub Alliance (PHTA) – one of the most widely cited authorities in the industry – the U.S. is home to approximately 10.7 million swimming pools. The vast majority of these are located at private residences, underscoring how deeply pools are woven into American suburban living rather than limited to hotels or public recreation facilities. While public and commercial pools play an important role in hospitality, fitness, and community recreation, they represent only a small fraction of the total pool inventory nationwide.
Here’s how U.S. swimming pools break down by type:
Put another way, there is roughly one swimming pool for every 31–32 people in the United States. However, this national average masks significant regional variation. In warm-weather states like Florida and Arizona, pool ownership is far more common, while colder, rural states have far fewer pools per household. This uneven distribution is what makes state-level and per-capita comparisons so valuable when answering questions like what state has the most swimming pools and where pool ownership is most concentrated.
| Pool Type | Estimated Count |
|---|---|
| Residential In-Ground Pools | ~6.1 million |
| Residential Above-Ground Pools | ~4.3 million |
| Public / Commercial Pools | ~309,000 |
Nationally, about 8% of U.S. households have a swimming pool – but this varies dramatically by state and metro.
Key takeaway:
Pool ownership is concentrated, not universal. It’s a lifestyle choice shaped by housing stock, income, climate, and culture.
Florida’s dominance in residential pool ownership isn’t accidental or driven by a single factor. Instead, it’s the result of several reinforcing dynamics that, together, have made private swimming pools a standard feature of everyday housing across much of the state.
Unlike most states, Florida offers a climate where swimming pools can be used for the majority of the year. Even during cooler months, mild winter temperatures and widespread use of pool heaters allow homeowners to enjoy their pools nearly year-round. This is especially evident in cities like Miami, where climate and lifestyle drive consistent pool usage. This extended usability dramatically increases the perceived value of owning a pool, turning it from a seasonal luxury into a functional part of daily life. As a result, Florida homeowners are far more willing to invest in installation, maintenance, and upgrades than residents in colder climates where pools sit unused for months at a time. These totals also highlight why ownership comes with ongoing costs, especially when considering how much it costs to maintain a pool each year.
Florida’s post-1970 suburban expansion played a major role in normalizing backyard pools. Large-scale residential developments – particularly in metro areas like Orlando, Tampa, Phoenix-style South Florida suburbs, and parts of Southwest Florida – were often designed with pools in mind from the outset. Larger lot sizes, single-story homes, screened enclosures, and HOAs that permit or even encourage pool construction all contributed to a built environment where adding a pool felt natural rather than exceptional. Over time, this design pattern embedded pools into Florida’s residential architecture.
Florida’s population mix further reinforces pool ownership. The state attracts a significant number of retirees who value pools for low-impact exercise, physical therapy, and leisure, while families with children rely on pools for recreation and social gatherings. Pools in Florida serve multiple functions at once: fitness spaces, entertainment hubs, and family-friendly amenities. This broad demographic appeal helps explain why pool ownership remains high across income levels and age groups rather than being concentrated only among luxury homeowners.
In many Florida metros, having a pool is no longer considered a premium upgrade – it’s an expectation. In some neighborhoods, especially in South Florida and Central Florida, homes without pools can even be viewed as less desirable. This cultural normalization creates a self-reinforcing cycle: buyers expect pools, developers build them, and homeowners maintain them to preserve property value. Over time, this expectation has made Florida the clear leader when answering the question, what state has the most swimming pools.
That said, Florida’s pool market is also mature, meaning competition among builders and service providers is intense, pricing pressure is high, and regulatory requirements – such as fencing laws and safety standards – are more stringent than in many other states. While Florida dominates in total pool count, its market dynamics differ significantly from emerging or under-served pool markets elsewhere in the country.
When people think about swimming pools, cold-weather states are often overlooked. Yet several Northern and Midwestern states quietly rank among the most pool-intensive markets in the country – not just in total pool count, but in maintenance demand and public pool density as well.
The following states consistently outperform expectations across multiple pool-related metrics:
What these states share is a combination of hot, humid summers, suburban housing patterns, and limited access to consistently warm natural swimming options. As a result, pools function as seasonal necessities rather than luxury upgrades – driving strong demand for installations, openings, closings, and long-term maintenance.
This pattern often surprises readers – and that’s exactly why it matters. Cold-climate states challenge the assumption that pool ownership is purely a warm-weather phenomenon and reveal how seasonality, population density, and housing design can outweigh climate alone. These seasonal markets also require more structured upkeep, making pool opening and maintenance planning a critical part of ownership.
Insight:
Cold-climate pools often generate more maintenance activity per pool per year than sunbelt pools due to openings, closings, freeze damage, and equipment wear.
Public swimming pools provide an often-overlooked indicator of overall pool density and swimming culture within a region. While residential pool counts show private ownership trends, public pools – such as municipal pools, recreation centers, school facilities, and community aquatic complexes – reflect broader investment in swimming infrastructure and water safety. Cities with a high number of public pools per 100,000 residents typically have long-standing swim programs, strong municipal recreation funding, and a population that actively engages in aquatic activities.
Cities with the highest number of public swimming pools per 100,000 residents include:
These cities are notable because they sit in colder climates where swimming is seasonal, yet still maintain a dense network of public pools. This suggests that swimming is treated not as a luxury, but as a public good – supported by schools, park systems, and local governments. In many cases, these facilities play a critical role in youth recreation, swim education, and community safety programs.
Public pools also operate under far stricter requirements than private residential pools. They typically require:
Because public pools set visible standards for safety, cleanliness, and oversight, they often influence expectations for residential pool ownership as well. In regions with dense public pool infrastructure, homeowners are more likely to view pool safety features, inspections, and professional maintenance as standard rather than optional. This dynamic helps explain why cities with strong public pool systems often also show elevated residential pool demand and heightened awareness around pool safety. This is also why awareness of common pool hazards and safety risks tends to be higher in these regions.
When people think about where swimming pools are most common, hot Sunbelt states usually come to mind. However, several states consistently outperform expectations when pool ownership is measured relative to population, climate, and housing patterns. These states demonstrate that pool density is shaped by more than just warm weather – factors like housing design, access to natural water, and seasonal intensity all play major roles.
New Mexico stands out as one of the most surprising states for high pool density per capita. Despite its relatively small population, the state ranks highly due to extreme summer heat, long stretches of dry weather, and limited access to swimmable natural water such as lakes or rivers. In many communities, private pools serve as the primary and safest way to cool off during peak summer months. Suburban development patterns and large lot sizes further support private pool installation, helping push New Mexico near the top of per-capita rankings.
At first glance, Massachusetts seems like an unlikely pool-heavy state given its short swimming season and long winters. Yet the state consistently ranks high in total residential pools and public pool density. This is driven by dense suburban development, high household incomes, and a strong culture of backyard recreation during hot, humid summers. Because pools are used intensively over a shorter season, they often require higher maintenance and more frequent servicing, increasing overall pool-related demand despite fewer months of use.
Pennsylvania and Michigan share a similar pattern that challenges climate-based assumptions. Both states experience hot, humid summers that make pools highly desirable, even though winters are long and cold. Large suburban and exurban lots make pool installation feasible, while aging residential pool infrastructure fuels ongoing maintenance, renovation, and safety upgrades. In Michigan’s case, cold lake temperatures and unpredictable weather further push homeowners toward controlled, private swimming environments rather than open water.
Together, these states reinforce an important insight: pool ownership is not driven by climate alone. Housing design, seasonal intensity, population density, and access to natural swimming alternatives all influence where pools are built and maintained. This is why several colder states continue to rank among the country’s most active pool markets – despite spending nearly half the year covered in snow. In these areas, private pools often replace natural water access, increasing reliance on pool safety equipment and protective systems.
While some states dominate pool ownership, others consistently rank at the bottom when it comes to residential swimming pool count. These bottom-ranking states share a set of geographic, climatic, and housing characteristics that make widespread pool ownership far less practical or desirable.
States with the fewest residential swimming pools include:
These states tend to fall at or near the bottom of rankings regardless of whether pools are measured by total count, per capita ownership, or percentage of households with swimming pools. The reasons extend well beyond temperature alone.
Several structural factors limit pool adoption in these regions:
In states like Alaska and Montana, extreme cold and remote geography further increase construction costs and maintenance challenges. Even during summer, cooler average temperatures and unpredictable weather make pools a less attractive investment for homeowners.
Taken together, these factors explain why certain states remain outliers in national pool statistics. Their low pool counts are not a reflection of lifestyle preferences alone, but of fundamental environmental and housing realities that limit demand for residential swimming pools.
In most markets, swimming pools do increase home value – but only under the right conditions. The impact of a pool on resale price depends heavily on location, home price tier, climate, and buyer expectations. While pools are often perceived as luxury amenities, their financial return varies widely across the country.
Nationally, real estate data suggests that an in-ground swimming pool typically increases a home’s value by approximately 5% to 8%. Based on the current U.S. median home price, this translates to an average resale gain of around $30,000. However, this figure represents a broad average – in resale value, meaning pools should rarely be viewed as a short-term financial investment. Instead, they function best as lifestyle upgrades that partially retain value, rather than profit-generating additions. However, this varies widely depending on location, as detailed in how much value a pool adds to a house in different markets.
The value a pool adds becomes much more pronounced when viewed at the metro level. According to Redfin’s analysis of home sales in major U.S. markets:
| Metro Area | Estimated Value Added |
|---|---|
| Los Angeles | ~$95,000 |
| Austin | ~$52,000 |
| Houston | ~$36,000 |
| Tampa | ~$30,000 |
| Phoenix | ~$11,500 |
These differences highlight how buyer expectations drive value. In markets like Los Angeles or Austin, pools are often considered standard features in higher-end homes, making their absence a disadvantage. In contrast, in lower-priced or extremely hot markets like Phoenix, pools are common enough that they add convenience rather than premium value.
Pools tend to deliver the strongest resale benefit in:
Conversely, in entry-level housing markets or colder climates, a pool can sometimes narrow the buyer pool or even reduce appeal due to maintenance, insurance, and safety concerns.
The takeaway is simple: pools increase home value when they align with local norms and buyer expectations. When they don’t, they become a lifestyle choice rather than a financial one – a distinction that matters for both homeowners and prospective buyers.
With widespread pool ownership comes responsibility.
At Pool Guard USA, safety isn’t optional – it’s the foundation of responsible pool ownership.
Learn More About Pool Safety:
👉 Free Pool Safety Checklist for Homeowners
So, what state has the most pools? The answer depends on how the question is framed. Florida leads the country by total number of swimming pools, supported by its large population, warm climate, and year-round pool culture. When adjusted for population size, Arizona ranks first for pools per capita, reflecting extreme heat, limited natural swimming options, and high suburban pool adoption. At the same time, colder states like Massachusetts, New Jersey, and Pennsylvania stand out for their unexpectedly high pool density, challenging the assumption that pools are only a warm-weather phenomenon.
Ultimately, swimming pool ownership in the U.S. is shaped by more than climate alone. Housing patterns, regional lifestyles, population density, and access to alternative recreation all play critical roles. Understanding where pools are most common – and why – helps homeowners, buyers, and safety-conscious families make smarter decisions about pool ownership, maintenance, and protection.
Data Sources:
Methodology:
Limitations:

Please fill out the form below with your information. Your local dealer will be notified about your inquiry.
Please fill out the form below with your information. Your local dealer will be notified about your inquiry.