Swimming pools are a defining feature of American residential life and a multi-billion-dollar global industry. Yet most “statistics” pages repeat the same shallow numbers without explaining what they actually mean.
This guide consolidates the most reliable swimming pool statistics available for 2026 — covering ownership patterns, market growth, safety system adoption, regulation, insurance exposure, and where the data gaps still exist. Every section is built to be citation-ready, insight-driven, and grounded in verified sources.
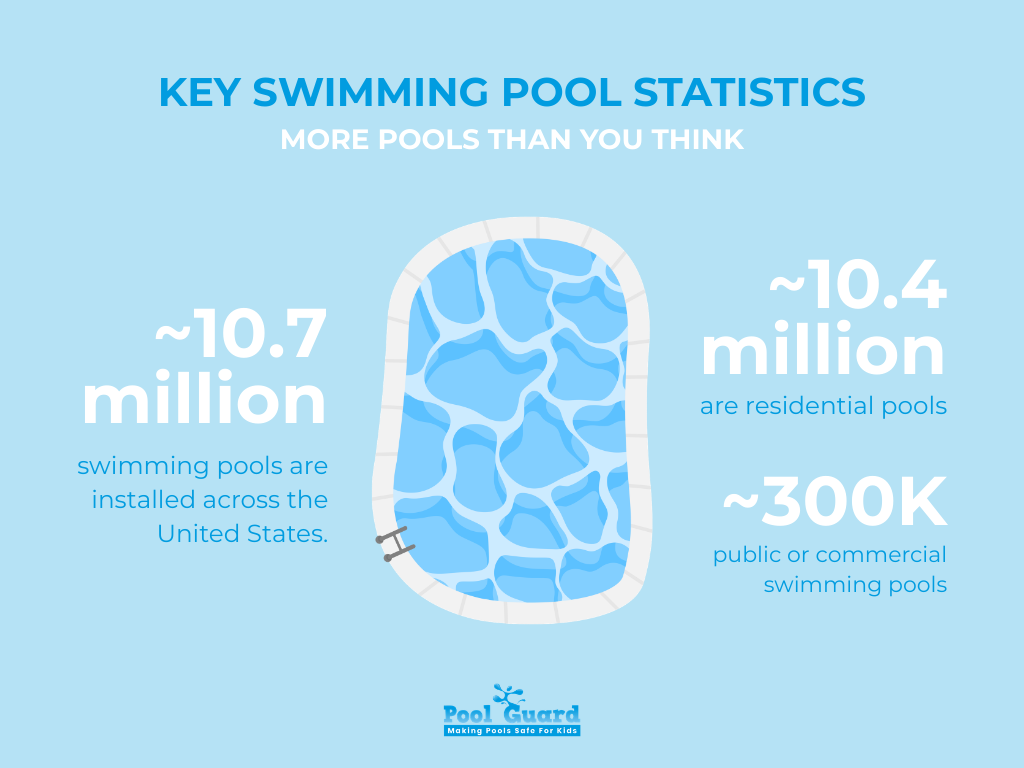
According to the Pool & Hot Tub Alliance (PHTA), there are approximately 10.7 million swimming pools in the United States, including about 10.4 million residential pools and just over 300,000 public or commercial pools. That translates to roughly 8% of U.S. households owning a swimming pool.
On the economic side, IBISWorld estimates the U.S. swimming pool construction industry exceeds $16 billion annually, with additional billions generated from cleaning services, equipment retail, and renovations. Globally, the swimming pool market is projected to surpass $9 billion in annual revenue by the early 2030s, depending on segment definitions and regional scope.
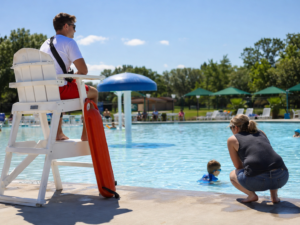
From a safety perspective, the Centers for Disease Control and Prevention (CDC) reports that drowning remains the leading cause of unintentional injury death for children ages 1–4, and the U.S. Consumer Product Safety Commission (CPSC) consistently finds that the majority of child pool drownings occur at private residential locations.
For updated U.S. drowning statistics, including recent CDC and CPSC data on residential pool incidents, refer to our in-depth 2026 drowning statistics report.
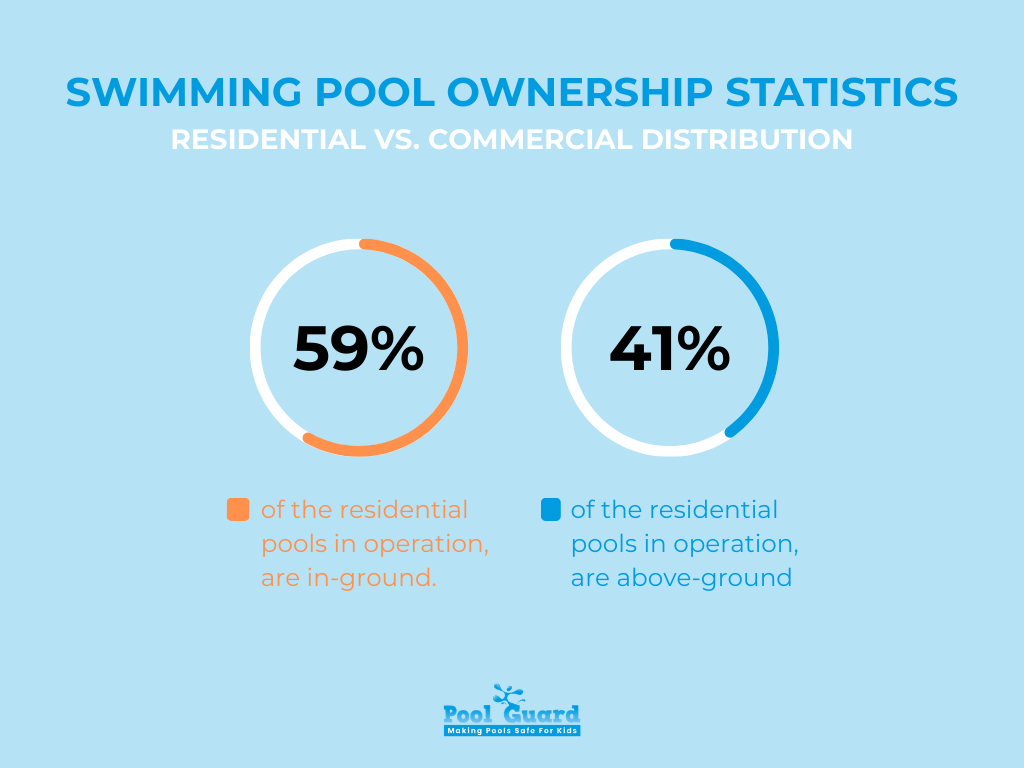
Residential pools dominate the landscape. Of the 10.4 million residential pools in operation, approximately 59% are in-ground and 41% are above-ground. Commercial pools — found in hotels, schools, fitness centers, and municipal facilities — represent a much smaller share numerically, but they drive significant regulatory oversight and higher per-facility spending on compliance and safety infrastructure.
Commercial facilities must comply with stricter building codes, ADA requirements, and public health regulations. Residential pools, by contrast, are regulated primarily at the state and municipal level, with enforcement varying widely.
Pool ownership is heavily influenced by climate, income, and housing type. Warm-weather states such as Florida, Arizona, Texas, and California account for a disproportionate share of installations. In states like Arizona, there is roughly one pool for every 13 residents, reflecting both climate necessity and lifestyle demand.
Ownership is significantly higher among single-family homeowners compared to renters or multi-family residents. Median home price and disposable income levels also correlate strongly with pool installation rates.
Swimming pools serve multiple functions:
Swimming has been included in the modern Olympic Games since 1896, reinforcing its longstanding role in sport and physical education. Increasing awareness of low-impact exercise benefits continues to support pool use in rehabilitation and wellness facilities.
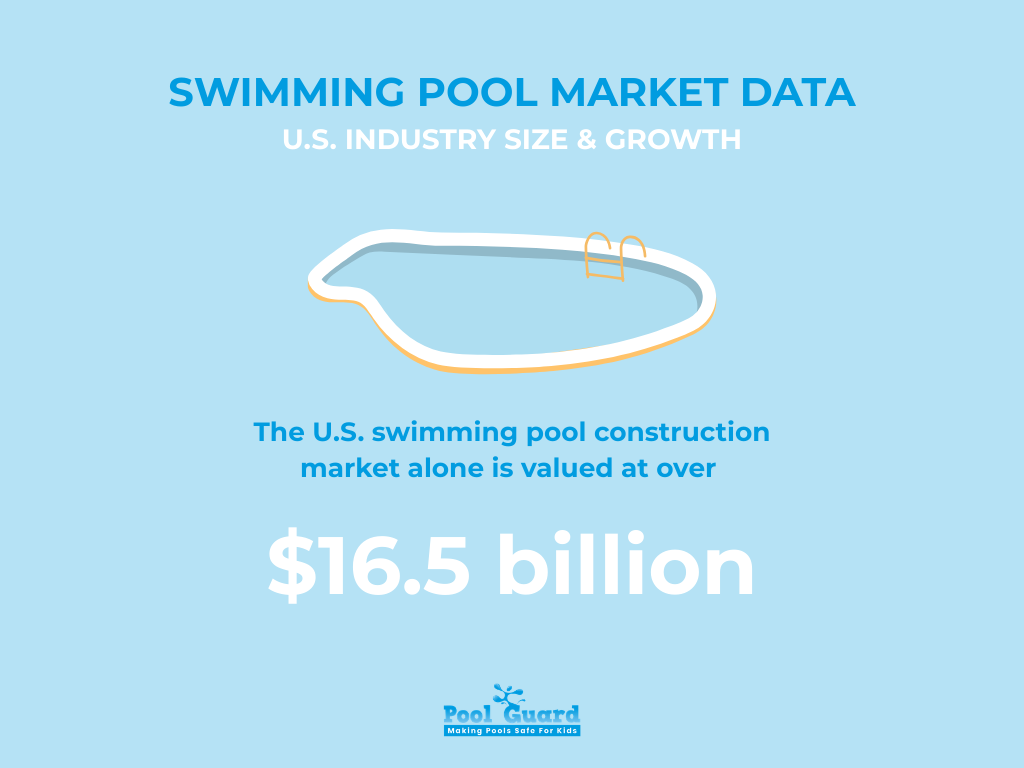
The U.S. swimming pool construction market alone is valued at over $16.5 billion, according to IBISWorld. When adding cleaning services (estimated at over $7 billion annually), retail equipment, chemicals, automation systems, and renovation services, the broader pool-related economy is substantially larger.
Recent historical growth has averaged approximately 3–5% annually, with post-2020 residential demand surging due to increased time spent at home and outdoor living investments.
While new construction remains strong in Sun Belt states, renovation and modernization have become increasingly important revenue drivers. Many U.S. residential pools are over 20 years old, creating ongoing demand for:
This shift means the industry is no longer purely growth-driven; it is increasingly lifecycle-driven.
Homeowners typically spend between $3,000 and $6,000 annually on maintenance, chemicals, electricity, water, seasonal opening/closing, and repairs (HomeGuide estimates). In-ground pool construction averages around $65,000, with material type (vinyl, fiberglass, concrete) heavily influencing total cost and longevity.
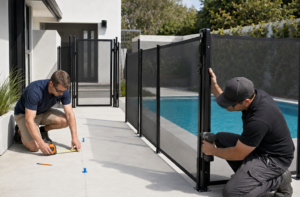
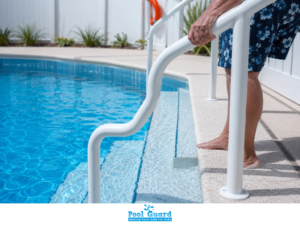
Safety best practices emphasize multiple protective layers. The most widely recommended measures include:
Precise national adoption rates for each system are difficult to determine due to fragmented reporting. However, commercial facilities are generally required to meet code-based barrier and access standards, while residential compliance varies significantly by jurisdiction.
Commercial pools must meet local health department codes and often undergo routine inspections. Residential pools are subject to building codes, but older installations may predate modern barrier laws.
As safety awareness increases, demand for retrofitted alarm systems and compliant fencing continues to grow, particularly in states with active enforcement.
Peer-reviewed research has demonstrated that four-sided isolation fencing significantly reduces the risk of drowning compared to three-sided fencing that uses the home as one boundary. Additionally, a National Institutes of Health–published study found that formal swim lessons reduce drowning risk among children ages 1–4 by up to 88%.
Experts widely endorse a “layers of protection” model. No single device eliminates risk. Instead, safety improves when supervision, physical barriers, alarms, and education work together.
Failures most often occur when protective layers are bypassed — such as propped gates, disabled alarms, or improperly secured covers.
Most U.S. states require some form of residential pool barrier under building codes. These often include minimum fence heights and self-latching gate requirements. Enforcement intensity varies by municipality.
Public and commercial pools must comply with federal accessibility standards, including requirements under the Americans with Disabilities Act (ADA) for lift access in many cases.
Recent code updates have increasingly emphasized barrier integrity and alarm requirements, particularly in high-growth states.
Home insurers classify pools as an “attractive nuisance,” meaning they increase liability exposure. As a result, carriers often require minimum barrier compliance before issuing coverage.
While precise nationwide claim frequency data is not publicly aggregated in detail, insurers routinely report that pools increase liability risk, particularly in cases involving unsupervised child access.
Homes with documented safety features may qualify for underwriting consideration, depending on the insurer.
The pool safety products market is expanding alongside automation growth. Homeowners increasingly invest in:
Post-pandemic spending patterns show a shift toward upgrading existing installations rather than building new ones alone.
Commercial operators prioritize compliance and inspection readiness, while residential owners increasingly focus on monitoring and child safety integration.
There is no centralized national database tracking residential safety feature adoption, compliance inspection failure rates, or alarm installation percentages.
Data remains fragmented across the CDC, CPSC, state health departments, industry associations, and private market research firms. This makes comprehensive benchmarking challenging and creates an opportunity for improved transparency and reporting standards.
The U.S. swimming pool market remains robust, driven by residential ownership, renovation cycles, and technological innovation. At the same time, drowning statistics and insurance exposure underscore the importance of layered safety systems and regulatory compliance.
Understanding current swimming pool statistics and broader swimming pool industry statistics helps homeowners, operators, insurers, and policymakers make informed decisions grounded in reality — not assumptions.
If you found this comprehensive breakdown useful, share it or explore related pool safety resources to stay informed.
Please fill out the form below with your information. Your local dealer will be notified about your inquiry.
Please fill out the form below with your information. Your local dealer will be notified about your inquiry.